Haitian vs Immigrants from Eastern Asia Unemployment Among Women with Children Under 18 years

COMPARE

Haitian
Race
Ancestry
AfghanAfricanAlaska NativeAlaskan AthabascanAlbanianAleutAlsatianAmericanApacheArabArapahoArgentineanArmenianAssyrian/Chaldean/SyriacAustralianAustrianBahamianBangladeshiBarbadianBasqueBelgianBelizeanBermudanBhutaneseBlackfeetBolivianBrazilianBritishBritish West IndianBulgarianBurmeseCajunCambodianCanadianCape VerdeanCarpatho RusynCelticCentral AmericanCentral American IndianCherokeeCheyenneChickasawChileanChineseChippewaChoctawColombianColvilleComancheCosta RicanCreeCreekCroatianCrowCubanCypriotCzechCzechoslovakianDanishDelawareDominicanDutchDutch West IndianEastern EuropeanEcuadorianEgyptianEnglishEstonianEthiopianEuropeanFijianFilipinoFinnishFrenchFrench American IndianFrench CanadianGermanGerman RussianGhanaianGreekGuamanian/ChamorroGuatemalanGuyaneseHaitianHmongHonduranHopiHoumaHungarianIcelanderIndian (Asian)IndonesianInupiatIranianIraqiIrishIroquoisIsraeliItalianJamaicanJapaneseJordanianKenyanKiowaKoreanLaotianLatvianLebaneseLiberianLithuanianLumbeeLuxembourgerMacedonianMalaysianMalteseMarshalleseMenomineeMexicanMexican American IndianMongolianMoroccanNative HawaiianNavajoNepaleseNew ZealanderNicaraguanNigerianNorthern EuropeanNorwegianOkinawanOsageOttawaPaiutePakistaniPalestinianPanamanianParaguayanPennsylvania GermanPeruvianPimaPolishPortuguesePotawatomiPuebloPuerto RicanPuget Sound SalishRomanianRussianSalvadoranSamoanScandinavianScotch-IrishScottishSeminoleSenegaleseSerbianShoshoneSierra LeoneanSiouxSlavicSlovakSloveneSomaliSouth AfricanSouth AmericanSouth American IndianSoviet UnionSpaniardSpanishSpanish AmericanSpanish American IndianSri LankanSubsaharan AfricanSudaneseSwedishSwissSyrianTaiwaneseThaiTlingit-HaidaTohono O'OdhamTonganTrinidadian and TobagonianTsimshianTurkishU.S. Virgin IslanderUgandanUkrainianUruguayanUteVenezuelanVietnameseWelshWest IndianYakamaYaquiYugoslavianYumanYup'ikZimbabwean
Immigration
NonimmigrantsImmigrantsAfghanistanAfricaAlbaniaArgentinaArmeniaAsiaAustraliaAustriaBahamasBangladeshBarbadosBelarusBelgiumBelizeBoliviaBosnia and HerzegovinaBrazilBulgariaBurma/MyanmarCabo VerdeCambodiaCameroonCanadaCaribbeanCentral AmericaChileChinaColombiaCongoCosta RicaCroatiaCubaCzechoslovakiaDenmarkDominicaDominican RepublicEastern AfricaEastern EuropeEcuadorEgyptEl SalvadorEnglandEritreaEthiopiaEuropeFijiFranceGermanyGhanaGreeceGrenadaGuatemalaGuyanaHaitiHondurasHong KongHungaryIndiaIndonesiaIranIraqIrelandIsraelItalyJamaicaJapanJordanKazakhstanKenyaKoreaKuwaitLaosLatin AmericaLatviaLebanonLiberiaLithuaniaMalaysiaMexicoMicronesiaMiddle AfricaMoldovaMoroccoNepalNetherlandsNicaraguaNigeriaNorth AmericaNorth MacedoniaNorthern AfricaNorthern EuropeNorwayOceaniaPakistanPanamaPeruPhilippinesPolandPortugalRomaniaRussiaSaudi ArabiaScotlandSenegalSerbiaSierra LeoneSingaporeSomaliaSouth AfricaSouth AmericaSouth Central AsiaSouth Eastern AsiaSouthern EuropeSpainSri LankaSt. Vincent and the GrenadinesSudanSwedenSwitzerlandSyriaTaiwanThailandTrinidad and TobagoTurkeyUgandaUkraineUruguayUzbekistanVenezuelaVietnamWest IndiesWestern AfricaWestern AsiaWestern EuropeYemenZaireZimbabweAzores
Immigrants from Eastern Asia
Race
Ancestry
AfghanAfricanAlaska NativeAlaskan AthabascanAlbanianAleutAlsatianAmericanApacheArabArapahoArgentineanArmenianAssyrian/Chaldean/SyriacAustralianAustrianBahamianBangladeshiBarbadianBasqueBelgianBelizeanBermudanBhutaneseBlackfeetBolivianBrazilianBritishBritish West IndianBulgarianBurmeseCajunCambodianCanadianCape VerdeanCarpatho RusynCelticCentral AmericanCentral American IndianCherokeeCheyenneChickasawChileanChineseChippewaChoctawColombianColvilleComancheCosta RicanCreeCreekCroatianCrowCubanCypriotCzechCzechoslovakianDanishDelawareDominicanDutchDutch West IndianEastern EuropeanEcuadorianEgyptianEnglishEstonianEthiopianEuropeanFijianFilipinoFinnishFrenchFrench American IndianFrench CanadianGermanGerman RussianGhanaianGreekGuamanian/ChamorroGuatemalanGuyaneseHmongHonduranHopiHoumaHungarianIcelanderIndian (Asian)IndonesianInupiatIranianIraqiIrishIroquoisIsraeliItalianJamaicanJapaneseJordanianKenyanKiowaKoreanLaotianLatvianLebaneseLiberianLithuanianLumbeeLuxembourgerMacedonianMalaysianMalteseMarshalleseMenomineeMexicanMexican American IndianMongolianMoroccanNative HawaiianNavajoNepaleseNew ZealanderNicaraguanNigerianNorthern EuropeanNorwegianOkinawanOsageOttawaPaiutePakistaniPalestinianPanamanianParaguayanPennsylvania GermanPeruvianPimaPolishPortuguesePotawatomiPuebloPuerto RicanPuget Sound SalishRomanianRussianSalvadoranSamoanScandinavianScotch-IrishScottishSeminoleSenegaleseSerbianShoshoneSierra LeoneanSiouxSlavicSlovakSloveneSomaliSouth AfricanSouth AmericanSouth American IndianSoviet UnionSpaniardSpanishSpanish AmericanSpanish American IndianSri LankanSubsaharan AfricanSudaneseSwedishSwissSyrianTaiwaneseThaiTlingit-HaidaTohono O'OdhamTonganTrinidadian and TobagonianTsimshianTurkishU.S. Virgin IslanderUgandanUkrainianUruguayanUteVenezuelanVietnameseWelshWest IndianYakamaYaquiYugoslavianYumanYup'ikZimbabwean
Immigration
NonimmigrantsImmigrantsAfghanistanAfricaAlbaniaArgentinaArmeniaAsiaAustraliaAustriaBahamasBangladeshBarbadosBelarusBelgiumBelizeBoliviaBosnia and HerzegovinaBrazilBulgariaBurma/MyanmarCabo VerdeCambodiaCameroonCanadaCaribbeanCentral AmericaChileChinaColombiaCongoCosta RicaCroatiaCubaCzechoslovakiaDenmarkDominicaDominican RepublicEastern AfricaEastern AsiaEastern EuropeEcuadorEgyptEl SalvadorEnglandEritreaEthiopiaEuropeFijiFranceGermanyGhanaGreeceGrenadaGuatemalaGuyanaHaitiHondurasHong KongHungaryIndiaIndonesiaIranIraqIrelandIsraelItalyJamaicaJapanJordanKazakhstanKenyaKoreaKuwaitLaosLatin AmericaLatviaLebanonLiberiaLithuaniaMalaysiaMexicoMicronesiaMiddle AfricaMoldovaMoroccoNepalNetherlandsNicaraguaNigeriaNorth AmericaNorth MacedoniaNorthern AfricaNorthern EuropeNorwayOceaniaPakistanPanamaPeruPhilippinesPolandPortugalRomaniaRussiaSaudi ArabiaScotlandSenegalSerbiaSierra LeoneSingaporeSomaliaSouth AfricaSouth AmericaSouth Central AsiaSouth Eastern AsiaSouthern EuropeSpainSri LankaSt. Vincent and the GrenadinesSudanSwedenSwitzerlandSyriaTaiwanThailandTrinidad and TobagoTurkeyUgandaUkraineUruguayUzbekistanVenezuelaVietnamWest IndiesWestern AfricaWestern AsiaWestern EuropeYemenZaireZimbabweAzores
Unemployment Among Women with Children Under 18 years
Income
Poverty
Unemployment
Labor Participation
Family Structure
Vehicle Availability
Education Level
Disability

Unemployment Among Women with Children Under 18 years Comparison

Haitians

Immigrants from Eastern Asia

Tragic
Exceptional
6.4%
UNEMPLOYMENT AMONG WOMEN WITH CHILDREN UNDER 18 YEARS
0.0/ 100
METRIC RATING
296th/ 347
METRIC RANK
4.9%
UNEMPLOYMENT AMONG WOMEN WITH CHILDREN UNDER 18 YEARS
99.5/ 100
METRIC RATING
28th/ 347
METRIC RANK

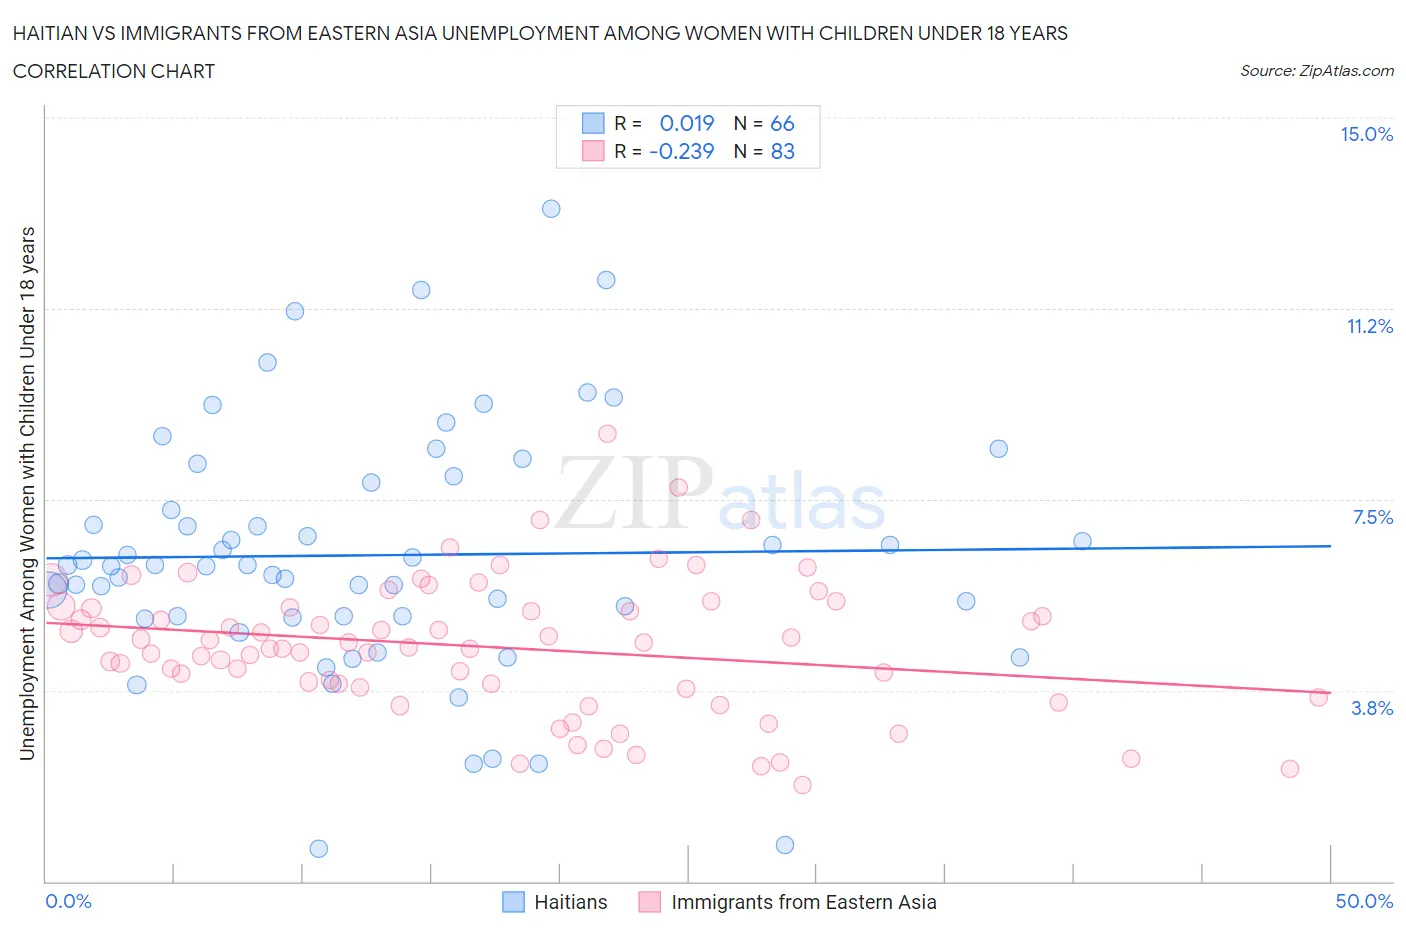
Haitian vs Immigrants from Eastern Asia Unemployment Among Women with Children Under 18 years Correlation Chart

The statistical analysis conducted on geographies consisting of 280,150,036 people shows no correlation between the proportion of Haitians and unemployment rate among women with children under the age of 18 in the United States with a correlation coefficient (R) of 0.019 and weighted average of 6.4%. Similarly, the statistical analysis conducted on geographies consisting of 470,021,238 people shows a weak negative correlation between the proportion of Immigrants from Eastern Asia and unemployment rate among women with children under the age of 18 in the United States with a correlation coefficient (R) of -0.239 and weighted average of 4.9%, a difference of 29.2%.
Haitian vs Immigrants from Eastern Asia Unemployment Among Women with Children Under 18 years

Unemployment Among Women with Children Under 18 years Correlation Summary

MeasurementHaitianImmigrants from Eastern Asia
Minimum0.65%1.9%
Maximum13.2%8.8%
Range12.6%6.9%
Mean6.4%4.6%
Median6.2%4.6%
Interquartile 25% (IQ1)5.2%3.8%
Interquartile 75% (IQ3)7.8%5.4%
Interquartile Range (IQR)2.6%1.6%
Standard Deviation (Sample)2.4%1.3%
Standard Deviation (Population)2.4%1.3%

Similar Demographics by Unemployment Among Women with Children Under 18 years

Demographics Similar to Haitians by Unemployment Among Women with Children Under 18 years

In terms of unemployment among women with children under 18 years, the demographic groups most similar to Haitians are Barbadian (6.4%, a difference of 0.020%), Immigrants from Senegal (6.4%, a difference of 0.040%), Honduran (6.4%, a difference of 0.10%), Immigrants from Bangladesh (6.4%, a difference of 0.13%), and Mexican (6.4%, a difference of 0.16%).
DemographicsRating | RankUnemployment Among Women with Children Under 18 years
Immigrants | Caribbean
0.0
/100
|
#289
Tragic
6.4%
Blackfeet
0.0
/100
|
#290
Tragic
6.4%
Immigrants | Guatemala
0.0
/100
|
#291
Tragic
6.4%
Mexicans
0.0
/100
|
#292
Tragic
6.4%
Immigrants | Bangladesh
0.0
/100
|
#293
Tragic
6.4%
Hondurans
0.0
/100
|
#294
Tragic
6.4%
Barbadians
0.0
/100
|
#295
Tragic
6.4%
Haitians
0.0
/100
|
#296
Tragic
6.4%
Immigrants | Senegal
0.0
/100
|
#297
Tragic
6.4%
Immigrants | Latin America
0.0
/100
|
#298
Tragic
6.4%
Jamaicans
0.0
/100
|
#299
Tragic
6.4%
Immigrants | Jamaica
0.0
/100
|
#300
Tragic
6.4%
Immigrants | Haiti
0.0
/100
|
#301
Tragic
6.4%
Immigrants | Armenia
0.0
/100
|
#302
Tragic
6.5%
Immigrants | Honduras
0.0
/100
|
#303
Tragic
6.5%

Demographics Similar to Immigrants from Eastern Asia by Unemployment Among Women with Children Under 18 years

In terms of unemployment among women with children under 18 years, the demographic groups most similar to Immigrants from Eastern Asia are Finnish (4.9%, a difference of 0.050%), Burmese (4.9%, a difference of 0.12%), Soviet Union (4.9%, a difference of 0.16%), Swiss (4.9%, a difference of 0.23%), and Chinese (4.9%, a difference of 0.34%).
DemographicsRating | RankUnemployment Among Women with Children Under 18 years
Europeans
99.6
/100
|
#21
Exceptional
4.9%
Indians (Asian)
99.6
/100
|
#22
Exceptional
4.9%
Immigrants | China
99.6
/100
|
#23
Exceptional
4.9%
Belgians
99.5
/100
|
#24
Exceptional
4.9%
Chinese
99.5
/100
|
#25
Exceptional
4.9%
Swiss
99.5
/100
|
#26
Exceptional
4.9%
Soviet Union
99.5
/100
|
#27
Exceptional
4.9%
Immigrants | Eastern Asia
99.5
/100
|
#28
Exceptional
4.9%
Finns
99.4
/100
|
#29
Exceptional
4.9%
Burmese
99.4
/100
|
#30
Exceptional
4.9%
Cypriots
99.3
/100
|
#31
Exceptional
5.0%
Dutch
99.3
/100
|
#32
Exceptional
5.0%
Croatians
99.3
/100
|
#33
Exceptional
5.0%
Immigrants | South Central Asia
99.2
/100
|
#34
Exceptional
5.0%
Luxembourgers
99.2
/100
|
#35
Exceptional
5.0%