Haitian vs Hmong Male Unemployment
COMPARE
Haitian
Hmong
Male Unemployment
Male Unemployment Comparison
Haitians
Hmong
6.4%
MALE UNEMPLOYMENT
0.0/ 100
METRIC RATING
293rd/ 347
METRIC RANK
5.5%
MALE UNEMPLOYMENT
7.0/ 100
METRIC RATING
212th/ 347
METRIC RANK
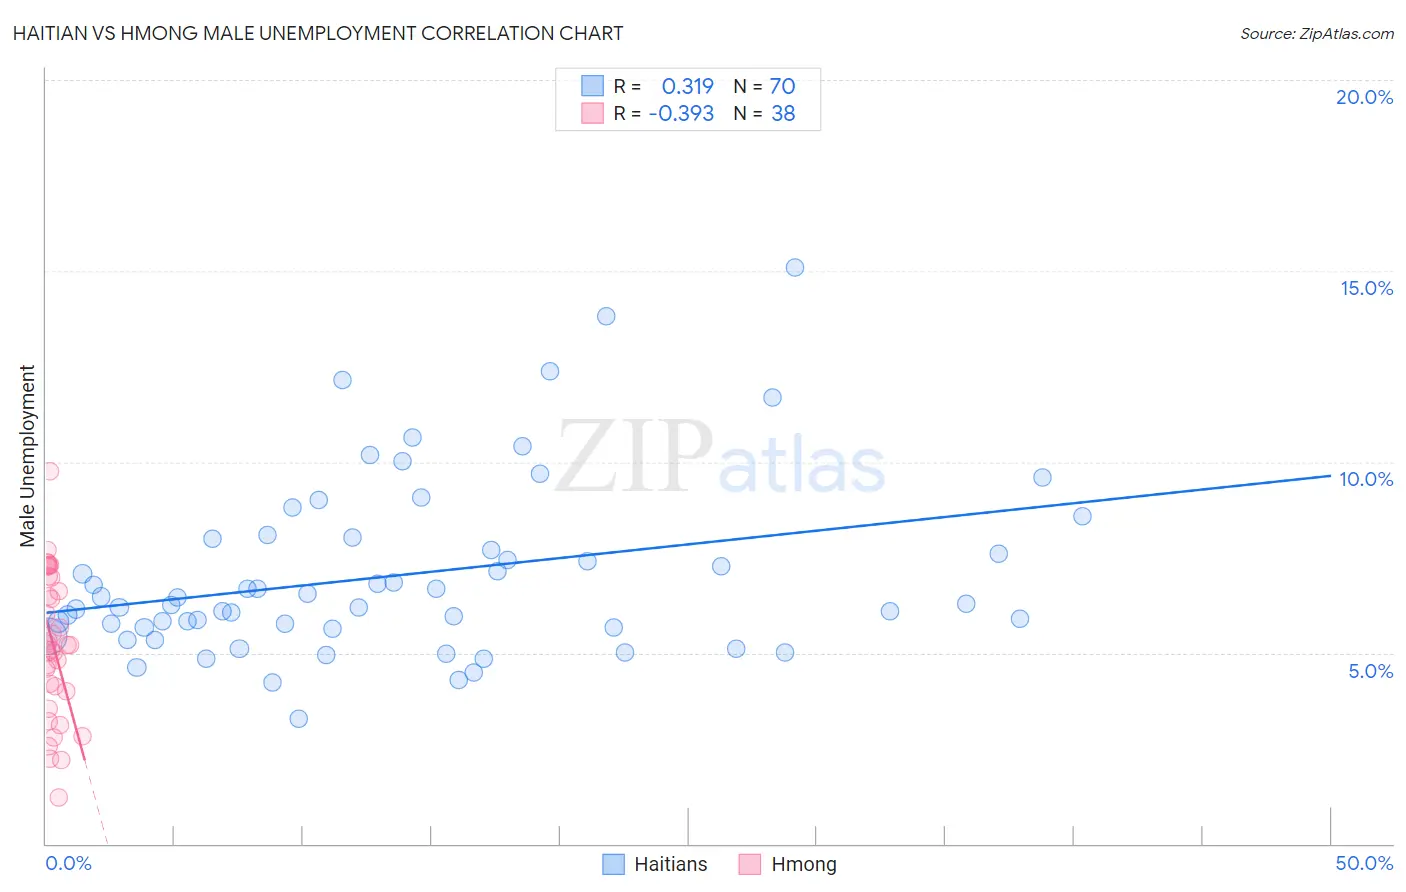
Haitian vs Hmong Male Unemployment Correlation Chart
The statistical analysis conducted on geographies consisting of 287,158,450 people shows a mild positive correlation between the proportion of Haitians and unemployment rate among males in the United States with a correlation coefficient (R) of 0.319 and weighted average of 6.4%. Similarly, the statistical analysis conducted on geographies consisting of 24,680,008 people shows a mild negative correlation between the proportion of Hmong and unemployment rate among males in the United States with a correlation coefficient (R) of -0.393 and weighted average of 5.5%, a difference of 17.2%.
Male Unemployment Correlation Summary
| Measurement | Haitian | Hmong |
| Minimum | 3.3% | 1.2% |
| Maximum | 15.1% | 9.8% |
| Range | 11.8% | 8.6% |
| Mean | 7.0% | 5.2% |
| Median | 6.3% | 5.2% |
| Interquartile 25% (IQ1) | 5.7% | 4.0% |
| Interquartile 75% (IQ3) | 8.0% | 7.0% |
| Interquartile Range (IQR) | 2.3% | 3.0% |
| Standard Deviation (Sample) | 2.3% | 1.9% |
| Standard Deviation (Population) | 2.3% | 1.9% |
Similar Demographics by Male Unemployment
Demographics Similar to Haitians by Male Unemployment
In terms of male unemployment, the demographic groups most similar to Haitians are Nepalese (6.4%, a difference of 0.030%), Senegalese (6.4%, a difference of 0.11%), Immigrants from the Azores (6.4%, a difference of 0.38%), U.S. Virgin Islander (6.4%, a difference of 0.90%), and Belizean (6.5%, a difference of 0.96%).
| Demographics | Rating | Rank | Male Unemployment |
| Africans | 0.0 /100 | #286 | Tragic 6.3% |
| Central American Indians | 0.0 /100 | #287 | Tragic 6.3% |
| Immigrants | Senegal | 0.0 /100 | #288 | Tragic 6.3% |
| Immigrants | Caribbean | 0.0 /100 | #289 | Tragic 6.3% |
| U.S. Virgin Islanders | 0.0 /100 | #290 | Tragic 6.4% |
| Immigrants | Azores | 0.0 /100 | #291 | Tragic 6.4% |
| Nepalese | 0.0 /100 | #292 | Tragic 6.4% |
| Haitians | 0.0 /100 | #293 | Tragic 6.4% |
| Senegalese | 0.0 /100 | #294 | Tragic 6.4% |
| Belizeans | 0.0 /100 | #295 | Tragic 6.5% |
| Immigrants | Haiti | 0.0 /100 | #296 | Tragic 6.5% |
| Chippewa | 0.0 /100 | #297 | Tragic 6.6% |
| Jamaicans | 0.0 /100 | #298 | Tragic 6.6% |
| Immigrants | Bangladesh | 0.0 /100 | #299 | Tragic 6.6% |
| Vietnamese | 0.0 /100 | #300 | Tragic 6.6% |
Demographics Similar to Hmong by Male Unemployment
In terms of male unemployment, the demographic groups most similar to Hmong are Israeli (5.5%, a difference of 0.090%), South American Indian (5.5%, a difference of 0.14%), Ugandan (5.5%, a difference of 0.16%), Immigrants from Middle Africa (5.5%, a difference of 0.27%), and Immigrants from Lebanon (5.5%, a difference of 0.32%).
| Demographics | Rating | Rank | Male Unemployment |
| Immigrants | Costa Rica | 11.4 /100 | #205 | Poor 5.5% |
| Immigrants | Ukraine | 9.9 /100 | #206 | Tragic 5.5% |
| Immigrants | Syria | 9.3 /100 | #207 | Tragic 5.5% |
| Immigrants | Lebanon | 8.6 /100 | #208 | Tragic 5.5% |
| Immigrants | Middle Africa | 8.3 /100 | #209 | Tragic 5.5% |
| South American Indians | 7.6 /100 | #210 | Tragic 5.5% |
| Israelis | 7.4 /100 | #211 | Tragic 5.5% |
| Hmong | 7.0 /100 | #212 | Tragic 5.5% |
| Ugandans | 6.3 /100 | #213 | Tragic 5.5% |
| Puget Sound Salish | 5.6 /100 | #214 | Tragic 5.5% |
| Samoans | 4.9 /100 | #215 | Tragic 5.5% |
| Immigrants | Immigrants | 4.3 /100 | #216 | Tragic 5.5% |
| Delaware | 4.2 /100 | #217 | Tragic 5.5% |
| Immigrants | Albania | 3.6 /100 | #218 | Tragic 5.5% |
| Immigrants | Western Asia | 3.5 /100 | #219 | Tragic 5.6% |