Guyanese vs Tlingit-Haida Unemployment Among Ages 45 to 54 years

COMPARE

Guyanese
Race
Ancestry
AfghanAfricanAlaska NativeAlaskan AthabascanAlbanianAleutAlsatianAmericanApacheArabArapahoArgentineanArmenianAssyrian/Chaldean/SyriacAustralianAustrianBahamianBangladeshiBarbadianBasqueBelgianBelizeanBermudanBhutaneseBlackfeetBolivianBrazilianBritishBritish West IndianBulgarianBurmeseCajunCambodianCanadianCape VerdeanCarpatho RusynCelticCentral AmericanCentral American IndianCherokeeCheyenneChickasawChileanChineseChippewaChoctawColombianColvilleComancheCosta RicanCreeCreekCroatianCrowCubanCypriotCzechCzechoslovakianDanishDelawareDominicanDutchDutch West IndianEastern EuropeanEcuadorianEgyptianEnglishEstonianEthiopianEuropeanFijianFilipinoFinnishFrenchFrench American IndianFrench CanadianGermanGerman RussianGhanaianGreekGuamanian/ChamorroGuatemalanGuyaneseHaitianHmongHonduranHopiHoumaHungarianIcelanderIndian (Asian)IndonesianInupiatIranianIraqiIrishIroquoisIsraeliItalianJamaicanJapaneseJordanianKenyanKiowaKoreanLaotianLatvianLebaneseLiberianLithuanianLumbeeLuxembourgerMacedonianMalaysianMalteseMarshalleseMenomineeMexicanMexican American IndianMongolianMoroccanNative HawaiianNavajoNepaleseNew ZealanderNicaraguanNigerianNorthern EuropeanNorwegianOkinawanOsageOttawaPaiutePakistaniPalestinianPanamanianParaguayanPennsylvania GermanPeruvianPimaPolishPortuguesePotawatomiPuebloPuerto RicanPuget Sound SalishRomanianRussianSalvadoranSamoanScandinavianScotch-IrishScottishSeminoleSenegaleseSerbianShoshoneSierra LeoneanSiouxSlavicSlovakSloveneSomaliSouth AfricanSouth AmericanSouth American IndianSoviet UnionSpaniardSpanishSpanish AmericanSpanish American IndianSri LankanSubsaharan AfricanSudaneseSwedishSwissSyrianTaiwaneseThaiTohono O'OdhamTonganTrinidadian and TobagonianTsimshianTurkishU.S. Virgin IslanderUgandanUkrainianUruguayanUteVenezuelanVietnameseWelshWest IndianYakamaYaquiYugoslavianYumanYup'ikZimbabwean
Immigration
NonimmigrantsImmigrantsAfghanistanAfricaAlbaniaArgentinaArmeniaAsiaAustraliaAustriaBahamasBangladeshBarbadosBelarusBelgiumBelizeBoliviaBosnia and HerzegovinaBrazilBulgariaBurma/MyanmarCabo VerdeCambodiaCameroonCanadaCaribbeanCentral AmericaChileChinaColombiaCongoCosta RicaCroatiaCubaCzechoslovakiaDenmarkDominicaDominican RepublicEastern AfricaEastern AsiaEastern EuropeEcuadorEgyptEl SalvadorEnglandEritreaEthiopiaEuropeFijiFranceGermanyGhanaGreeceGrenadaGuatemalaGuyanaHaitiHondurasHong KongHungaryIndiaIndonesiaIranIraqIrelandIsraelItalyJamaicaJapanJordanKazakhstanKenyaKoreaKuwaitLaosLatin AmericaLatviaLebanonLiberiaLithuaniaMalaysiaMexicoMicronesiaMiddle AfricaMoldovaMoroccoNepalNetherlandsNicaraguaNigeriaNorth AmericaNorth MacedoniaNorthern AfricaNorthern EuropeNorwayOceaniaPakistanPanamaPeruPhilippinesPolandPortugalRomaniaRussiaSaudi ArabiaScotlandSenegalSerbiaSierra LeoneSingaporeSomaliaSouth AfricaSouth AmericaSouth Central AsiaSouth Eastern AsiaSouthern EuropeSpainSri LankaSt. Vincent and the GrenadinesSudanSwedenSwitzerlandSyriaTaiwanThailandTrinidad and TobagoTurkeyUgandaUkraineUruguayUzbekistanVenezuelaVietnamWest IndiesWestern AfricaWestern AsiaWestern EuropeYemenZaireZimbabweAzores
Tlingit-Haida
Race
Ancestry
AfghanAfricanAlaska NativeAlaskan AthabascanAlbanianAleutAlsatianAmericanApacheArabArapahoArgentineanArmenianAssyrian/Chaldean/SyriacAustralianAustrianBahamianBangladeshiBarbadianBasqueBelgianBelizeanBermudanBhutaneseBlackfeetBolivianBrazilianBritishBritish West IndianBulgarianBurmeseCajunCambodianCanadianCape VerdeanCarpatho RusynCelticCentral AmericanCentral American IndianCherokeeCheyenneChickasawChileanChineseChippewaChoctawColombianColvilleComancheCosta RicanCreeCreekCroatianCrowCubanCypriotCzechCzechoslovakianDanishDelawareDominicanDutchDutch West IndianEastern EuropeanEcuadorianEgyptianEnglishEstonianEthiopianEuropeanFijianFilipinoFinnishFrenchFrench American IndianFrench CanadianGermanGerman RussianGhanaianGreekGuamanian/ChamorroGuatemalanHaitianHmongHonduranHopiHoumaHungarianIcelanderIndian (Asian)IndonesianInupiatIranianIraqiIrishIroquoisIsraeliItalianJamaicanJapaneseJordanianKenyanKiowaKoreanLaotianLatvianLebaneseLiberianLithuanianLumbeeLuxembourgerMacedonianMalaysianMalteseMarshalleseMenomineeMexicanMexican American IndianMongolianMoroccanNative HawaiianNavajoNepaleseNew ZealanderNicaraguanNigerianNorthern EuropeanNorwegianOkinawanOsageOttawaPaiutePakistaniPalestinianPanamanianParaguayanPennsylvania GermanPeruvianPimaPolishPortuguesePotawatomiPuebloPuerto RicanPuget Sound SalishRomanianRussianSalvadoranSamoanScandinavianScotch-IrishScottishSeminoleSenegaleseSerbianShoshoneSierra LeoneanSiouxSlavicSlovakSloveneSomaliSouth AfricanSouth AmericanSouth American IndianSoviet UnionSpaniardSpanishSpanish AmericanSpanish American IndianSri LankanSubsaharan AfricanSudaneseSwedishSwissSyrianTaiwaneseThaiTlingit-HaidaTohono O'OdhamTonganTrinidadian and TobagonianTsimshianTurkishU.S. Virgin IslanderUgandanUkrainianUruguayanUteVenezuelanVietnameseWelshWest IndianYakamaYaquiYugoslavianYumanYup'ikZimbabwean
Immigration
NonimmigrantsImmigrantsAfghanistanAfricaAlbaniaArgentinaArmeniaAsiaAustraliaAustriaBahamasBangladeshBarbadosBelarusBelgiumBelizeBoliviaBosnia and HerzegovinaBrazilBulgariaBurma/MyanmarCabo VerdeCambodiaCameroonCanadaCaribbeanCentral AmericaChileChinaColombiaCongoCosta RicaCroatiaCubaCzechoslovakiaDenmarkDominicaDominican RepublicEastern AfricaEastern AsiaEastern EuropeEcuadorEgyptEl SalvadorEnglandEritreaEthiopiaEuropeFijiFranceGermanyGhanaGreeceGrenadaGuatemalaGuyanaHaitiHondurasHong KongHungaryIndiaIndonesiaIranIraqIrelandIsraelItalyJamaicaJapanJordanKazakhstanKenyaKoreaKuwaitLaosLatin AmericaLatviaLebanonLiberiaLithuaniaMalaysiaMexicoMicronesiaMiddle AfricaMoldovaMoroccoNepalNetherlandsNicaraguaNigeriaNorth AmericaNorth MacedoniaNorthern AfricaNorthern EuropeNorwayOceaniaPakistanPanamaPeruPhilippinesPolandPortugalRomaniaRussiaSaudi ArabiaScotlandSenegalSerbiaSierra LeoneSingaporeSomaliaSouth AfricaSouth AmericaSouth Central AsiaSouth Eastern AsiaSouthern EuropeSpainSri LankaSt. Vincent and the GrenadinesSudanSwedenSwitzerlandSyriaTaiwanThailandTrinidad and TobagoTurkeyUgandaUkraineUruguayUzbekistanVenezuelaVietnamWest IndiesWestern AfricaWestern AsiaWestern EuropeYemenZaireZimbabweAzores
Unemployment Among Ages 45 to 54 years
Income
Poverty
Unemployment
Labor Participation
Family Structure
Vehicle Availability
Education Level
Disability

Unemployment Among Ages 45 to 54 years Comparison

Guyanese

Tlingit-Haida

Tragic
Tragic
5.6%
UNEMPLOYMENT AMONG AGES 45 TO 54 YEARS
0.0/ 100
METRIC RATING
314th/ 347
METRIC RANK
4.7%
UNEMPLOYMENT AMONG AGES 45 TO 54 YEARS
2.3/ 100
METRIC RATING
236th/ 347
METRIC RANK

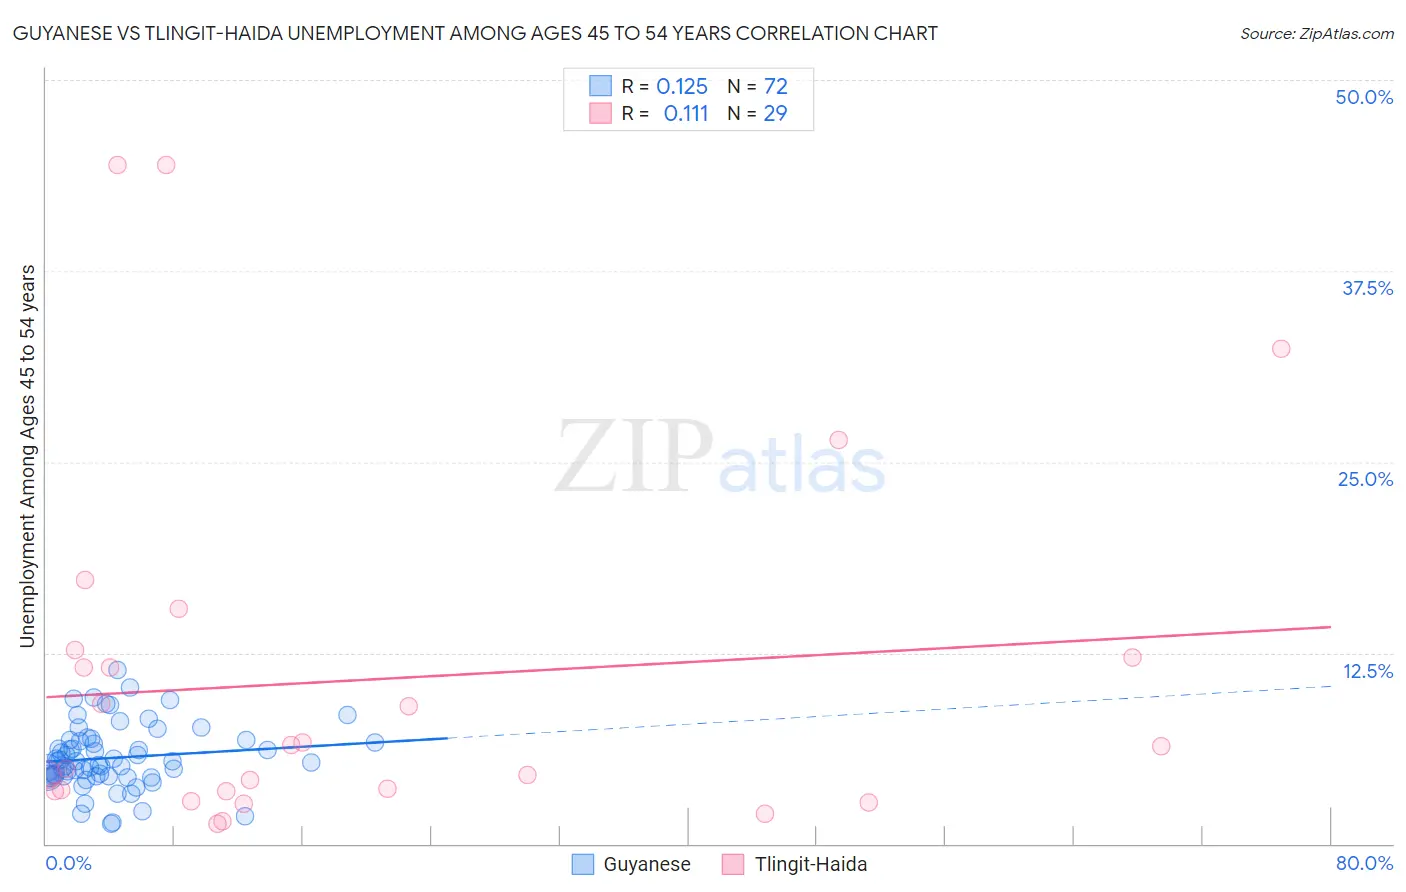
Guyanese vs Tlingit-Haida Unemployment Among Ages 45 to 54 years Correlation Chart

The statistical analysis conducted on geographies consisting of 175,185,002 people shows a poor positive correlation between the proportion of Guyanese and unemployment rate among population between the ages 45 and 54 in the United States with a correlation coefficient (R) of 0.125 and weighted average of 5.6%. Similarly, the statistical analysis conducted on geographies consisting of 60,127,685 people shows a poor positive correlation between the proportion of Tlingit-Haida and unemployment rate among population between the ages 45 and 54 in the United States with a correlation coefficient (R) of 0.111 and weighted average of 4.7%, a difference of 18.8%.
Guyanese vs Tlingit-Haida Unemployment Among Ages 45 to 54 years

Unemployment Among Ages 45 to 54 years Correlation Summary

MeasurementGuyaneseTlingit-Haida
Minimum1.3%1.3%
Maximum11.4%44.4%
Range10.1%43.1%
Mean5.6%10.7%
Median5.3%6.4%
Interquartile 25% (IQ1)4.4%3.4%
Interquartile 75% (IQ3)6.7%12.4%
Interquartile Range (IQR)2.3%9.0%
Standard Deviation (Sample)2.1%11.8%
Standard Deviation (Population)2.1%11.6%

Similar Demographics by Unemployment Among Ages 45 to 54 years

Demographics Similar to Guyanese by Unemployment Among Ages 45 to 54 years

In terms of unemployment among ages 45 to 54 years, the demographic groups most similar to Guyanese are Immigrants from Dominica (5.6%, a difference of 0.18%), Shoshone (5.6%, a difference of 0.33%), Immigrants from Grenada (5.6%, a difference of 0.37%), Immigrants from Guyana (5.6%, a difference of 0.38%), and Houma (5.6%, a difference of 0.48%).
DemographicsRating | RankUnemployment Among Ages 45 to 54 years
Vietnamese
0.0
/100
|
#307
Tragic
5.4%
Blacks/African Americans
0.0
/100
|
#308
Tragic
5.4%
Barbadians
0.0
/100
|
#309
Tragic
5.5%
Immigrants | Barbados
0.0
/100
|
#310
Tragic
5.5%
Chippewa
0.0
/100
|
#311
Tragic
5.5%
Immigrants | Grenada
0.0
/100
|
#312
Tragic
5.6%
Shoshone
0.0
/100
|
#313
Tragic
5.6%
Guyanese
0.0
/100
|
#314
Tragic
5.6%
Immigrants | Dominica
0.0
/100
|
#315
Tragic
5.6%
Immigrants | Guyana
0.0
/100
|
#316
Tragic
5.6%
Houma
0.0
/100
|
#317
Tragic
5.6%
British West Indians
0.0
/100
|
#318
Tragic
5.7%
Cape Verdeans
0.0
/100
|
#319
Tragic
5.7%
Immigrants | St. Vincent and the Grenadines
0.0
/100
|
#320
Tragic
5.7%
Yakama
0.0
/100
|
#321
Tragic
5.7%

Demographics Similar to Tlingit-Haida by Unemployment Among Ages 45 to 54 years

In terms of unemployment among ages 45 to 54 years, the demographic groups most similar to Tlingit-Haida are Cree (4.7%, a difference of 0.010%), Soviet Union (4.7%, a difference of 0.16%), Immigrants (4.7%, a difference of 0.18%), Ottawa (4.7%, a difference of 0.21%), and Immigrants from Ireland (4.7%, a difference of 0.22%).
DemographicsRating | RankUnemployment Among Ages 45 to 54 years
Immigrants | Israel
3.0
/100
|
#229
Tragic
4.7%
Japanese
2.8
/100
|
#230
Tragic
4.7%
Immigrants | Ireland
2.7
/100
|
#231
Tragic
4.7%
Ottawa
2.7
/100
|
#232
Tragic
4.7%
Immigrants | Immigrants
2.6
/100
|
#233
Tragic
4.7%
Soviet Union
2.6
/100
|
#234
Tragic
4.7%
Cree
2.3
/100
|
#235
Tragic
4.7%
Tlingit-Haida
2.3
/100
|
#236
Tragic
4.7%
Alsatians
1.6
/100
|
#237
Tragic
4.7%
Yaqui
1.4
/100
|
#238
Tragic
4.7%
Spanish Americans
1.4
/100
|
#239
Tragic
4.7%
Immigrants | Iraq
1.3
/100
|
#240
Tragic
4.7%
Delaware
1.3
/100
|
#241
Tragic
4.8%
Central Americans
1.3
/100
|
#242
Tragic
4.8%
Portuguese
1.1
/100
|
#243
Tragic
4.8%