Guyanese vs Immigrants from Czechoslovakia Unemployment Among Ages 16 to 19 years

COMPARE

Guyanese
Race
Ancestry
AfghanAfricanAlaska NativeAlaskan AthabascanAlbanianAleutAlsatianAmericanApacheArabArapahoArgentineanArmenianAssyrian/Chaldean/SyriacAustralianAustrianBahamianBangladeshiBarbadianBasqueBelgianBelizeanBermudanBhutaneseBlackfeetBolivianBrazilianBritishBritish West IndianBulgarianBurmeseCajunCambodianCanadianCape VerdeanCarpatho RusynCelticCentral AmericanCentral American IndianCherokeeCheyenneChickasawChileanChineseChippewaChoctawColombianColvilleComancheCosta RicanCreeCreekCroatianCrowCubanCypriotCzechCzechoslovakianDanishDelawareDominicanDutchDutch West IndianEastern EuropeanEcuadorianEgyptianEnglishEstonianEthiopianEuropeanFijianFilipinoFinnishFrenchFrench American IndianFrench CanadianGermanGerman RussianGhanaianGreekGuamanian/ChamorroGuatemalanGuyaneseHaitianHmongHonduranHopiHoumaHungarianIcelanderIndian (Asian)IndonesianInupiatIranianIraqiIrishIroquoisIsraeliItalianJamaicanJapaneseJordanianKenyanKiowaKoreanLaotianLatvianLebaneseLiberianLithuanianLumbeeLuxembourgerMacedonianMalaysianMalteseMarshalleseMenomineeMexicanMexican American IndianMongolianMoroccanNative HawaiianNavajoNepaleseNew ZealanderNicaraguanNigerianNorthern EuropeanNorwegianOkinawanOsageOttawaPaiutePakistaniPalestinianPanamanianParaguayanPennsylvania GermanPeruvianPimaPolishPortuguesePotawatomiPuebloPuerto RicanPuget Sound SalishRomanianRussianSalvadoranSamoanScandinavianScotch-IrishScottishSeminoleSenegaleseSerbianShoshoneSierra LeoneanSiouxSlavicSlovakSloveneSomaliSouth AfricanSouth AmericanSouth American IndianSoviet UnionSpaniardSpanishSpanish AmericanSpanish American IndianSri LankanSubsaharan AfricanSudaneseSwedishSwissSyrianTaiwaneseThaiTlingit-HaidaTohono O'OdhamTonganTrinidadian and TobagonianTsimshianTurkishU.S. Virgin IslanderUgandanUkrainianUruguayanUteVenezuelanVietnameseWelshWest IndianYakamaYaquiYugoslavianYumanYup'ikZimbabwean
Immigration
NonimmigrantsImmigrantsAfghanistanAfricaAlbaniaArgentinaArmeniaAsiaAustraliaAustriaBahamasBangladeshBarbadosBelarusBelgiumBelizeBoliviaBosnia and HerzegovinaBrazilBulgariaBurma/MyanmarCabo VerdeCambodiaCameroonCanadaCaribbeanCentral AmericaChileChinaColombiaCongoCosta RicaCroatiaCubaDenmarkDominicaDominican RepublicEastern AfricaEastern AsiaEastern EuropeEcuadorEgyptEl SalvadorEnglandEritreaEthiopiaEuropeFijiFranceGermanyGhanaGreeceGrenadaGuatemalaGuyanaHaitiHondurasHong KongHungaryIndiaIndonesiaIranIraqIrelandIsraelItalyJamaicaJapanJordanKazakhstanKenyaKoreaKuwaitLaosLatin AmericaLatviaLebanonLiberiaLithuaniaMalaysiaMexicoMicronesiaMiddle AfricaMoldovaMoroccoNepalNetherlandsNicaraguaNigeriaNorth AmericaNorth MacedoniaNorthern AfricaNorthern EuropeNorwayOceaniaPakistanPanamaPeruPhilippinesPolandPortugalRomaniaRussiaSaudi ArabiaScotlandSenegalSerbiaSierra LeoneSingaporeSomaliaSouth AfricaSouth AmericaSouth Central AsiaSouth Eastern AsiaSouthern EuropeSpainSri LankaSt. Vincent and the GrenadinesSudanSwedenSwitzerlandSyriaTaiwanThailandTrinidad and TobagoTurkeyUgandaUkraineUruguayUzbekistanVenezuelaVietnamWest IndiesWestern AfricaWestern AsiaWestern EuropeYemenZaireZimbabweAzores
Immigrants from Czechoslovakia
Race
Ancestry
AfghanAfricanAlaska NativeAlaskan AthabascanAlbanianAleutAlsatianAmericanApacheArabArapahoArgentineanArmenianAssyrian/Chaldean/SyriacAustralianAustrianBahamianBangladeshiBarbadianBasqueBelgianBelizeanBermudanBhutaneseBlackfeetBolivianBrazilianBritishBritish West IndianBulgarianBurmeseCajunCambodianCanadianCape VerdeanCarpatho RusynCelticCentral AmericanCentral American IndianCherokeeCheyenneChickasawChileanChineseChippewaChoctawColombianColvilleComancheCosta RicanCreeCreekCroatianCrowCubanCypriotCzechCzechoslovakianDanishDelawareDominicanDutchDutch West IndianEastern EuropeanEcuadorianEgyptianEnglishEstonianEthiopianEuropeanFijianFilipinoFinnishFrenchFrench American IndianFrench CanadianGermanGerman RussianGhanaianGreekGuamanian/ChamorroGuatemalanHaitianHmongHonduranHopiHoumaHungarianIcelanderIndian (Asian)IndonesianInupiatIranianIraqiIrishIroquoisIsraeliItalianJamaicanJapaneseJordanianKenyanKiowaKoreanLaotianLatvianLebaneseLiberianLithuanianLumbeeLuxembourgerMacedonianMalaysianMalteseMarshalleseMenomineeMexicanMexican American IndianMongolianMoroccanNative HawaiianNavajoNepaleseNew ZealanderNicaraguanNigerianNorthern EuropeanNorwegianOkinawanOsageOttawaPaiutePakistaniPalestinianPanamanianParaguayanPennsylvania GermanPeruvianPimaPolishPortuguesePotawatomiPuebloPuerto RicanPuget Sound SalishRomanianRussianSalvadoranSamoanScandinavianScotch-IrishScottishSeminoleSenegaleseSerbianShoshoneSierra LeoneanSiouxSlavicSlovakSloveneSomaliSouth AfricanSouth AmericanSouth American IndianSoviet UnionSpaniardSpanishSpanish AmericanSpanish American IndianSri LankanSubsaharan AfricanSudaneseSwedishSwissSyrianTaiwaneseThaiTlingit-HaidaTohono O'OdhamTonganTrinidadian and TobagonianTsimshianTurkishU.S. Virgin IslanderUgandanUkrainianUruguayanUteVenezuelanVietnameseWelshWest IndianYakamaYaquiYugoslavianYumanYup'ikZimbabwean
Immigration
NonimmigrantsImmigrantsAfghanistanAfricaAlbaniaArgentinaArmeniaAsiaAustraliaAustriaBahamasBangladeshBarbadosBelarusBelgiumBelizeBoliviaBosnia and HerzegovinaBrazilBulgariaBurma/MyanmarCabo VerdeCambodiaCameroonCanadaCaribbeanCentral AmericaChileChinaColombiaCongoCosta RicaCroatiaCubaCzechoslovakiaDenmarkDominicaDominican RepublicEastern AfricaEastern AsiaEastern EuropeEcuadorEgyptEl SalvadorEnglandEritreaEthiopiaEuropeFijiFranceGermanyGhanaGreeceGrenadaGuatemalaGuyanaHaitiHondurasHong KongHungaryIndiaIndonesiaIranIraqIrelandIsraelItalyJamaicaJapanJordanKazakhstanKenyaKoreaKuwaitLaosLatin AmericaLatviaLebanonLiberiaLithuaniaMalaysiaMexicoMicronesiaMiddle AfricaMoldovaMoroccoNepalNetherlandsNicaraguaNigeriaNorth AmericaNorth MacedoniaNorthern AfricaNorthern EuropeNorwayOceaniaPakistanPanamaPeruPhilippinesPolandPortugalRomaniaRussiaSaudi ArabiaScotlandSenegalSerbiaSierra LeoneSingaporeSomaliaSouth AfricaSouth AmericaSouth Central AsiaSouth Eastern AsiaSouthern EuropeSpainSri LankaSt. Vincent and the GrenadinesSudanSwedenSwitzerlandSyriaTaiwanThailandTrinidad and TobagoTurkeyUgandaUkraineUruguayUzbekistanVenezuelaVietnamWest IndiesWestern AfricaWestern AsiaWestern EuropeYemenZaireZimbabweAzores
Unemployment Among Ages 16 to 19 years
Income
Poverty
Unemployment
Labor Participation
Family Structure
Vehicle Availability
Education Level
Disability

Unemployment Among Ages 16 to 19 years Comparison

Guyanese

Immigrants from Czechoslovakia

Tragic
Fair
24.8%
UNEMPLOYMENT AMONG AGES 16 TO 19 YEARS
0.0/ 100
METRIC RATING
334th/ 347
METRIC RANK
17.8%
UNEMPLOYMENT AMONG AGES 16 TO 19 YEARS
29.8/ 100
METRIC RATING
197th/ 347
METRIC RANK

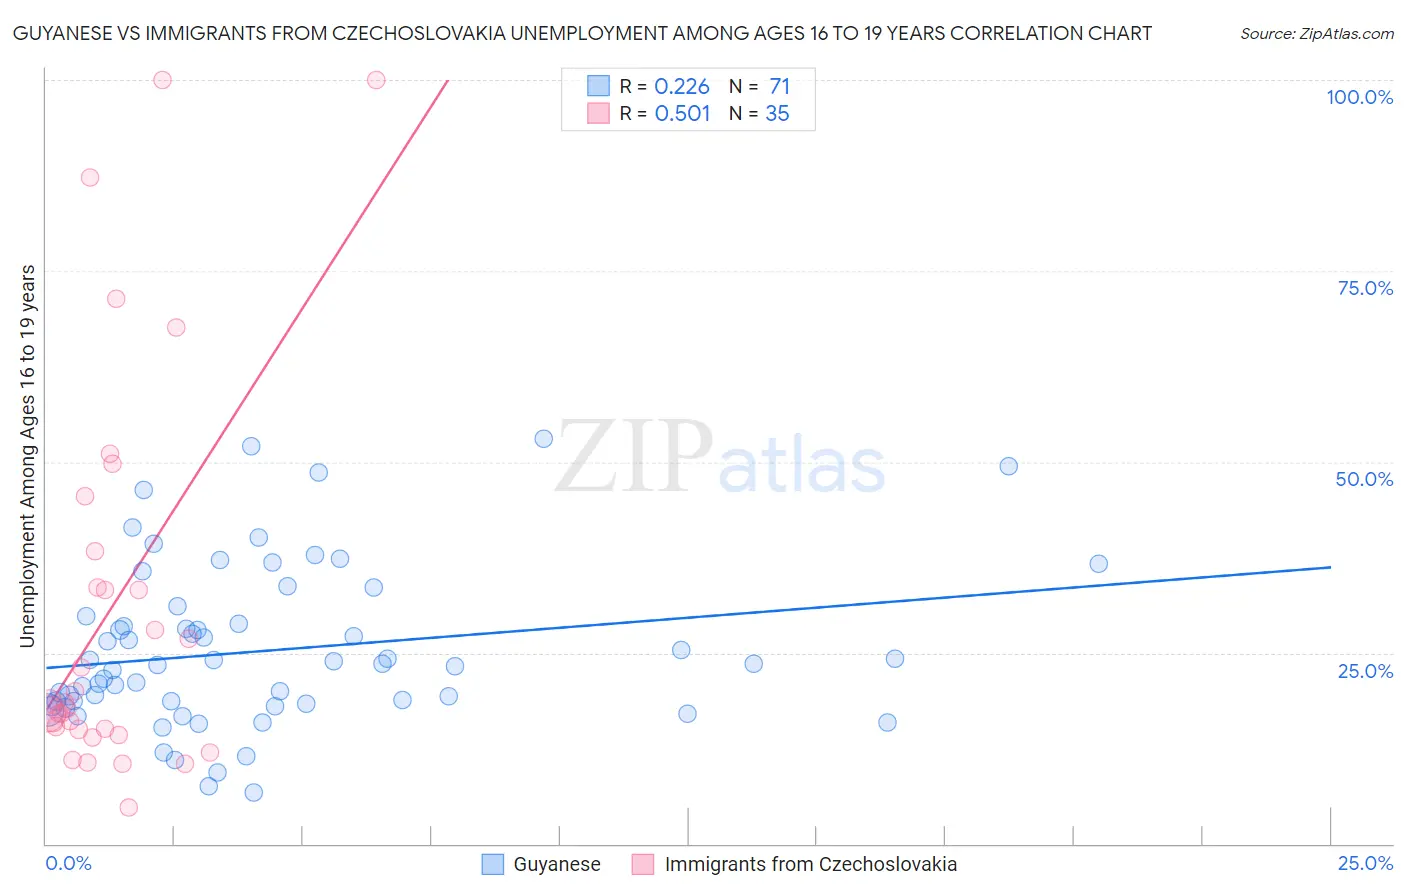
Guyanese vs Immigrants from Czechoslovakia Unemployment Among Ages 16 to 19 years Correlation Chart

The statistical analysis conducted on geographies consisting of 172,403,884 people shows a weak positive correlation between the proportion of Guyanese and unemployment rate among population between the ages 16 and 19 in the United States with a correlation coefficient (R) of 0.226 and weighted average of 24.8%. Similarly, the statistical analysis conducted on geographies consisting of 188,832,177 people shows a substantial positive correlation between the proportion of Immigrants from Czechoslovakia and unemployment rate among population between the ages 16 and 19 in the United States with a correlation coefficient (R) of 0.501 and weighted average of 17.8%, a difference of 39.9%.
Guyanese vs Immigrants from Czechoslovakia Unemployment Among Ages 16 to 19 years

Unemployment Among Ages 16 to 19 years Correlation Summary

MeasurementGuyaneseImmigrants from Czechoslovakia
Minimum6.7%4.8%
Maximum53.0%100.0%
Range46.3%95.2%
Mean25.3%30.8%
Median23.5%18.5%
Interquartile 25% (IQ1)18.4%15.0%
Interquartile 75% (IQ3)29.8%38.3%
Interquartile Range (IQR)11.5%23.3%
Standard Deviation (Sample)10.4%25.7%
Standard Deviation (Population)10.3%25.3%

Similar Demographics by Unemployment Among Ages 16 to 19 years

Demographics Similar to Guyanese by Unemployment Among Ages 16 to 19 years

In terms of unemployment among ages 16 to 19 years, the demographic groups most similar to Guyanese are Arapaho (25.2%, a difference of 1.3%), Kiowa (25.2%, a difference of 1.5%), Paiute (24.4%, a difference of 1.9%), Immigrants from Guyana (25.5%, a difference of 2.6%), and Immigrants from Barbados (24.0%, a difference of 3.4%).
DemographicsRating | RankUnemployment Among Ages 16 to 19 years
Pima
0.0
/100
|
#327
Tragic
23.1%
Immigrants | Dominican Republic
0.0
/100
|
#328
Tragic
23.3%
Tlingit-Haida
0.0
/100
|
#329
Tragic
23.5%
Dominicans
0.0
/100
|
#330
Tragic
23.6%
British West Indians
0.0
/100
|
#331
Tragic
24.0%
Immigrants | Barbados
0.0
/100
|
#332
Tragic
24.0%
Paiute
0.0
/100
|
#333
Tragic
24.4%
Guyanese
0.0
/100
|
#334
Tragic
24.8%
Arapaho
0.0
/100
|
#335
Tragic
25.2%
Kiowa
0.0
/100
|
#336
Tragic
25.2%
Immigrants | Guyana
0.0
/100
|
#337
Tragic
25.5%
Immigrants | St. Vincent and the Grenadines
0.0
/100
|
#338
Tragic
25.7%
Immigrants | Grenada
0.0
/100
|
#339
Tragic
25.7%
Crow
0.0
/100
|
#340
Tragic
26.2%
Puerto Ricans
0.0
/100
|
#341
Tragic
27.5%

Demographics Similar to Immigrants from Czechoslovakia by Unemployment Among Ages 16 to 19 years

In terms of unemployment among ages 16 to 19 years, the demographic groups most similar to Immigrants from Czechoslovakia are Ethiopian (17.8%, a difference of 0.010%), Immigrants from Ireland (17.8%, a difference of 0.070%), Immigrants from Fiji (17.8%, a difference of 0.12%), Immigrants from Ethiopia (17.8%, a difference of 0.14%), and Immigrants from Portugal (17.8%, a difference of 0.15%).
DemographicsRating | RankUnemployment Among Ages 16 to 19 years
Marshallese
41.7
/100
|
#190
Average
17.6%
Immigrants | Costa Rica
41.3
/100
|
#191
Average
17.6%
Immigrants | Philippines
40.7
/100
|
#192
Average
17.7%
Immigrants | Australia
40.6
/100
|
#193
Average
17.7%
Peruvians
38.8
/100
|
#194
Fair
17.7%
Immigrants | Peru
37.3
/100
|
#195
Fair
17.7%
Alaskan Athabascans
34.1
/100
|
#196
Fair
17.7%
Immigrants | Czechoslovakia
29.8
/100
|
#197
Fair
17.8%
Ethiopians
29.6
/100
|
#198
Fair
17.8%
Immigrants | Ireland
28.5
/100
|
#199
Fair
17.8%
Immigrants | Fiji
27.7
/100
|
#200
Fair
17.8%
Immigrants | Ethiopia
27.4
/100
|
#201
Fair
17.8%
Immigrants | Portugal
27.2
/100
|
#202
Fair
17.8%
Immigrants | Eastern Europe
23.6
/100
|
#203
Fair
17.8%
Immigrants | Nonimmigrants
20.9
/100
|
#204
Fair
17.9%