Guatemalan vs Immigrants from Iraq Unemployment Among Ages 16 to 19 years
COMPARE
Guatemalan
Immigrants from Iraq
Unemployment Among Ages 16 to 19 years
Unemployment Among Ages 16 to 19 years Comparison
Guatemalans
Immigrants from Iraq
18.6%
UNEMPLOYMENT AMONG AGES 16 TO 19 YEARS
0.8/ 100
METRIC RATING
244th/ 347
METRIC RANK
17.0%
UNEMPLOYMENT AMONG AGES 16 TO 19 YEARS
93.7/ 100
METRIC RATING
112th/ 347
METRIC RANK
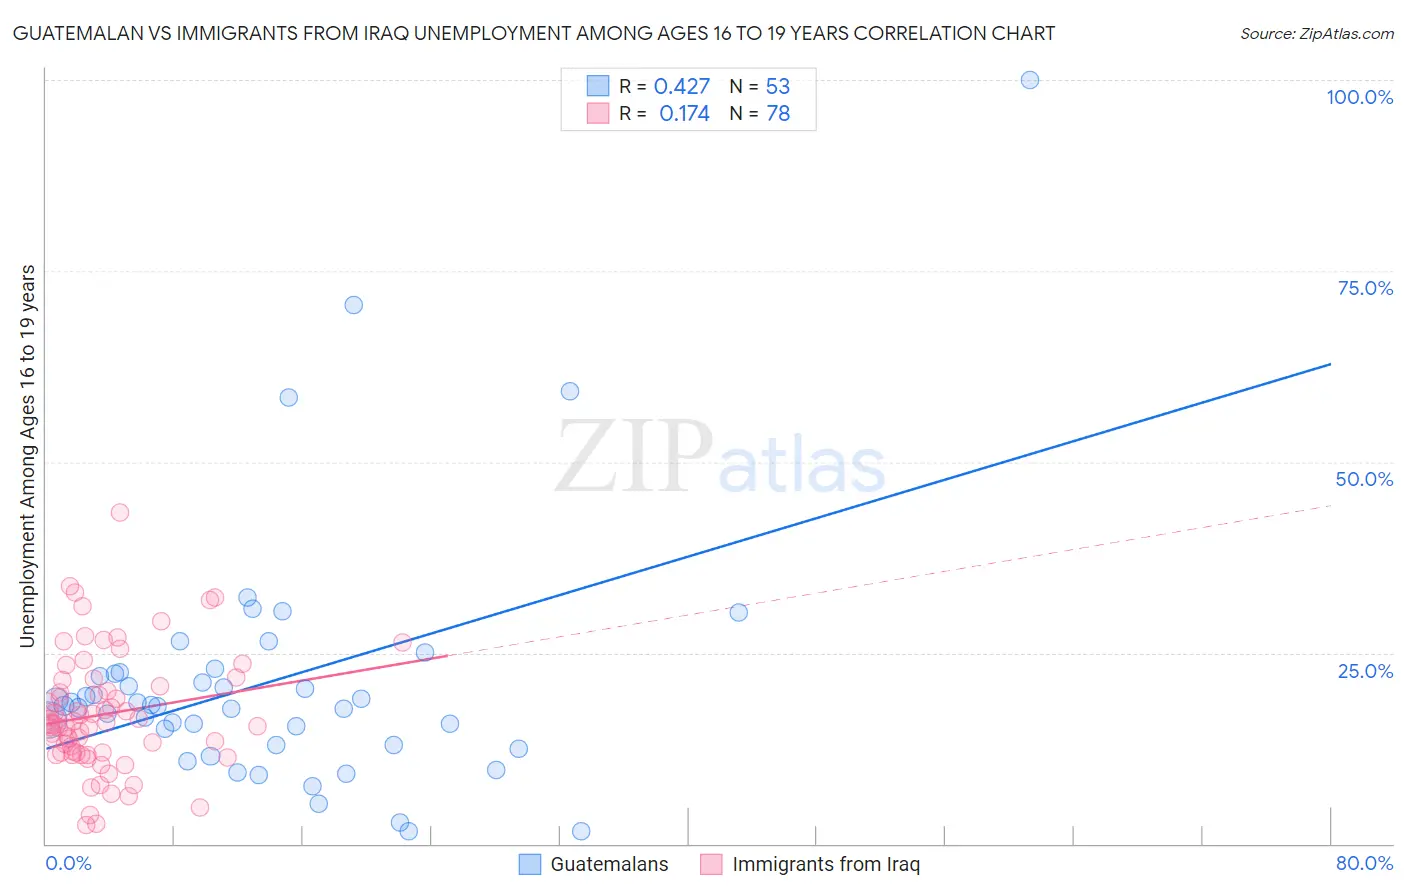
Guatemalan vs Immigrants from Iraq Unemployment Among Ages 16 to 19 years Correlation Chart
The statistical analysis conducted on geographies consisting of 390,544,351 people shows a moderate positive correlation between the proportion of Guatemalans and unemployment rate among population between the ages 16 and 19 in the United States with a correlation coefficient (R) of 0.427 and weighted average of 18.6%. Similarly, the statistical analysis conducted on geographies consisting of 189,846,896 people shows a poor positive correlation between the proportion of Immigrants from Iraq and unemployment rate among population between the ages 16 and 19 in the United States with a correlation coefficient (R) of 0.174 and weighted average of 17.0%, a difference of 9.2%.
Unemployment Among Ages 16 to 19 years Correlation Summary
| Measurement | Guatemalan | Immigrants from Iraq |
| Minimum | 1.7% | 2.5% |
| Maximum | 100.0% | 43.4% |
| Range | 98.3% | 40.9% |
| Mean | 21.3% | 17.0% |
| Median | 18.1% | 15.7% |
| Interquartile 25% (IQ1) | 12.9% | 12.0% |
| Interquartile 75% (IQ3) | 22.4% | 20.6% |
| Interquartile Range (IQR) | 9.4% | 8.6% |
| Standard Deviation (Sample) | 16.9% | 7.7% |
| Standard Deviation (Population) | 16.7% | 7.7% |
Similar Demographics by Unemployment Among Ages 16 to 19 years
Demographics Similar to Guatemalans by Unemployment Among Ages 16 to 19 years
In terms of unemployment among ages 16 to 19 years, the demographic groups most similar to Guatemalans are Immigrants from Belarus (18.6%, a difference of 0.010%), Mexican (18.5%, a difference of 0.21%), Moroccan (18.5%, a difference of 0.37%), Immigrants from South America (18.7%, a difference of 0.43%), and Immigrants from Israel (18.7%, a difference of 0.48%).
| Demographics | Rating | Rank | Unemployment Among Ages 16 to 19 years |
| Immigrants | Immigrants | 2.7 /100 | #237 | Tragic 18.3% |
| South Americans | 2.6 /100 | #238 | Tragic 18.3% |
| Native Hawaiians | 2.4 /100 | #239 | Tragic 18.3% |
| Immigrants | Cabo Verde | 2.0 /100 | #240 | Tragic 18.4% |
| Immigrants | Ukraine | 1.3 /100 | #241 | Tragic 18.5% |
| Moroccans | 1.1 /100 | #242 | Tragic 18.5% |
| Mexicans | 0.9 /100 | #243 | Tragic 18.5% |
| Guatemalans | 0.8 /100 | #244 | Tragic 18.6% |
| Immigrants | Belarus | 0.8 /100 | #245 | Tragic 18.6% |
| Immigrants | South America | 0.5 /100 | #246 | Tragic 18.7% |
| Immigrants | Israel | 0.5 /100 | #247 | Tragic 18.7% |
| Delaware | 0.5 /100 | #248 | Tragic 18.7% |
| Puget Sound Salish | 0.5 /100 | #249 | Tragic 18.7% |
| Panamanians | 0.4 /100 | #250 | Tragic 18.7% |
| Sub-Saharan Africans | 0.4 /100 | #251 | Tragic 18.7% |
Demographics Similar to Immigrants from Iraq by Unemployment Among Ages 16 to 19 years
In terms of unemployment among ages 16 to 19 years, the demographic groups most similar to Immigrants from Iraq are Immigrants from Asia (17.0%, a difference of 0.030%), Immigrants from Netherlands (17.0%, a difference of 0.040%), Icelander (17.0%, a difference of 0.060%), Iranian (17.0%, a difference of 0.080%), and Immigrants from Brazil (17.0%, a difference of 0.10%).
| Demographics | Rating | Rank | Unemployment Among Ages 16 to 19 years |
| Immigrants | Bulgaria | 94.3 /100 | #105 | Exceptional 17.0% |
| Estonians | 94.3 /100 | #106 | Exceptional 17.0% |
| Immigrants | Brazil | 94.2 /100 | #107 | Exceptional 17.0% |
| Malaysians | 94.2 /100 | #108 | Exceptional 17.0% |
| Iranians | 94.1 /100 | #109 | Exceptional 17.0% |
| Immigrants | Netherlands | 93.9 /100 | #110 | Exceptional 17.0% |
| Immigrants | Asia | 93.9 /100 | #111 | Exceptional 17.0% |
| Immigrants | Iraq | 93.7 /100 | #112 | Exceptional 17.0% |
| Icelanders | 93.4 /100 | #113 | Exceptional 17.0% |
| Immigrants | Poland | 93.1 /100 | #114 | Exceptional 17.0% |
| Brazilians | 92.3 /100 | #115 | Exceptional 17.1% |
| Immigrants | Korea | 92.2 /100 | #116 | Exceptional 17.1% |
| Immigrants | Sri Lanka | 92.0 /100 | #117 | Exceptional 17.1% |
| Venezuelans | 91.8 /100 | #118 | Exceptional 17.1% |
| Hungarians | 91.6 /100 | #119 | Exceptional 17.1% |