Ghanaian vs Vietnamese Unemployment Among Ages 25 to 29 years

COMPARE

Ghanaian
Race
Ancestry
AfghanAfricanAlaska NativeAlaskan AthabascanAlbanianAleutAlsatianAmericanApacheArabArapahoArgentineanArmenianAssyrian/Chaldean/SyriacAustralianAustrianBahamianBangladeshiBarbadianBasqueBelgianBelizeanBermudanBhutaneseBlackfeetBolivianBrazilianBritishBritish West IndianBulgarianBurmeseCajunCambodianCanadianCape VerdeanCarpatho RusynCelticCentral AmericanCentral American IndianCherokeeCheyenneChickasawChileanChineseChippewaChoctawColombianColvilleComancheCosta RicanCreeCreekCroatianCrowCubanCypriotCzechCzechoslovakianDanishDelawareDominicanDutchDutch West IndianEastern EuropeanEcuadorianEgyptianEnglishEstonianEthiopianEuropeanFijianFilipinoFinnishFrenchFrench American IndianFrench CanadianGermanGerman RussianGhanaianGreekGuamanian/ChamorroGuatemalanGuyaneseHaitianHmongHonduranHopiHoumaHungarianIcelanderIndian (Asian)IndonesianInupiatIranianIraqiIrishIroquoisIsraeliItalianJamaicanJapaneseJordanianKenyanKiowaKoreanLaotianLatvianLebaneseLiberianLithuanianLumbeeLuxembourgerMacedonianMalaysianMalteseMarshalleseMenomineeMexicanMexican American IndianMongolianMoroccanNative HawaiianNavajoNepaleseNew ZealanderNicaraguanNigerianNorthern EuropeanNorwegianOkinawanOsageOttawaPaiutePakistaniPalestinianPanamanianParaguayanPennsylvania GermanPeruvianPimaPolishPortuguesePotawatomiPuebloPuerto RicanPuget Sound SalishRomanianRussianSalvadoranSamoanScandinavianScotch-IrishScottishSeminoleSenegaleseSerbianShoshoneSierra LeoneanSiouxSlavicSlovakSloveneSomaliSouth AfricanSouth AmericanSouth American IndianSoviet UnionSpaniardSpanishSpanish AmericanSpanish American IndianSri LankanSubsaharan AfricanSudaneseSwedishSwissSyrianTaiwaneseThaiTlingit-HaidaTohono O'OdhamTonganTrinidadian and TobagonianTsimshianTurkishU.S. Virgin IslanderUgandanUkrainianUruguayanUteVenezuelanWelshWest IndianYakamaYaquiYugoslavianYumanYup'ikZimbabwean
Immigration
NonimmigrantsImmigrantsAfghanistanAfricaAlbaniaArgentinaArmeniaAsiaAustraliaAustriaBahamasBangladeshBarbadosBelarusBelgiumBelizeBoliviaBosnia and HerzegovinaBrazilBulgariaBurma/MyanmarCabo VerdeCambodiaCameroonCanadaCaribbeanCentral AmericaChileChinaColombiaCongoCosta RicaCroatiaCubaCzechoslovakiaDenmarkDominicaDominican RepublicEastern AfricaEastern AsiaEastern EuropeEcuadorEgyptEl SalvadorEnglandEritreaEthiopiaEuropeFijiFranceGermanyGhanaGreeceGrenadaGuatemalaGuyanaHaitiHondurasHong KongHungaryIndiaIndonesiaIranIraqIrelandIsraelItalyJamaicaJapanJordanKazakhstanKenyaKoreaKuwaitLaosLatin AmericaLatviaLebanonLiberiaLithuaniaMalaysiaMexicoMicronesiaMiddle AfricaMoldovaMoroccoNepalNetherlandsNicaraguaNigeriaNorth AmericaNorth MacedoniaNorthern AfricaNorthern EuropeNorwayOceaniaPakistanPanamaPeruPhilippinesPolandPortugalRomaniaRussiaSaudi ArabiaScotlandSenegalSerbiaSierra LeoneSingaporeSomaliaSouth AfricaSouth AmericaSouth Central AsiaSouth Eastern AsiaSouthern EuropeSpainSri LankaSt. Vincent and the GrenadinesSudanSwedenSwitzerlandSyriaTaiwanThailandTrinidad and TobagoTurkeyUgandaUkraineUruguayUzbekistanVenezuelaVietnamWest IndiesWestern AfricaWestern AsiaWestern EuropeYemenZaireZimbabweAzores
Vietnamese
Race
Ancestry
AfghanAfricanAlaska NativeAlaskan AthabascanAlbanianAleutAlsatianAmericanApacheArabArapahoArgentineanArmenianAssyrian/Chaldean/SyriacAustralianAustrianBahamianBangladeshiBarbadianBasqueBelgianBelizeanBermudanBhutaneseBlackfeetBolivianBrazilianBritishBritish West IndianBulgarianBurmeseCajunCambodianCanadianCape VerdeanCarpatho RusynCelticCentral AmericanCentral American IndianCherokeeCheyenneChickasawChileanChineseChippewaChoctawColombianColvilleComancheCosta RicanCreeCreekCroatianCrowCubanCypriotCzechCzechoslovakianDanishDelawareDominicanDutchDutch West IndianEastern EuropeanEcuadorianEgyptianEnglishEstonianEthiopianEuropeanFijianFilipinoFinnishFrenchFrench American IndianFrench CanadianGermanGerman RussianGreekGuamanian/ChamorroGuatemalanGuyaneseHaitianHmongHonduranHopiHoumaHungarianIcelanderIndian (Asian)IndonesianInupiatIranianIraqiIrishIroquoisIsraeliItalianJamaicanJapaneseJordanianKenyanKiowaKoreanLaotianLatvianLebaneseLiberianLithuanianLumbeeLuxembourgerMacedonianMalaysianMalteseMarshalleseMenomineeMexicanMexican American IndianMongolianMoroccanNative HawaiianNavajoNepaleseNew ZealanderNicaraguanNigerianNorthern EuropeanNorwegianOkinawanOsageOttawaPaiutePakistaniPalestinianPanamanianParaguayanPennsylvania GermanPeruvianPimaPolishPortuguesePotawatomiPuebloPuerto RicanPuget Sound SalishRomanianRussianSalvadoranSamoanScandinavianScotch-IrishScottishSeminoleSenegaleseSerbianShoshoneSierra LeoneanSiouxSlavicSlovakSloveneSomaliSouth AfricanSouth AmericanSouth American IndianSoviet UnionSpaniardSpanishSpanish AmericanSpanish American IndianSri LankanSubsaharan AfricanSudaneseSwedishSwissSyrianTaiwaneseThaiTlingit-HaidaTohono O'OdhamTonganTrinidadian and TobagonianTsimshianTurkishU.S. Virgin IslanderUgandanUkrainianUruguayanUteVenezuelanVietnameseWelshWest IndianYakamaYaquiYugoslavianYumanYup'ikZimbabwean
Immigration
NonimmigrantsImmigrantsAfghanistanAfricaAlbaniaArgentinaArmeniaAsiaAustraliaAustriaBahamasBangladeshBarbadosBelarusBelgiumBelizeBoliviaBosnia and HerzegovinaBrazilBulgariaBurma/MyanmarCabo VerdeCambodiaCameroonCanadaCaribbeanCentral AmericaChileChinaColombiaCongoCosta RicaCroatiaCubaCzechoslovakiaDenmarkDominicaDominican RepublicEastern AfricaEastern AsiaEastern EuropeEcuadorEgyptEl SalvadorEnglandEritreaEthiopiaEuropeFijiFranceGermanyGhanaGreeceGrenadaGuatemalaGuyanaHaitiHondurasHong KongHungaryIndiaIndonesiaIranIraqIrelandIsraelItalyJamaicaJapanJordanKazakhstanKenyaKoreaKuwaitLaosLatin AmericaLatviaLebanonLiberiaLithuaniaMalaysiaMexicoMicronesiaMiddle AfricaMoldovaMoroccoNepalNetherlandsNicaraguaNigeriaNorth AmericaNorth MacedoniaNorthern AfricaNorthern EuropeNorwayOceaniaPakistanPanamaPeruPhilippinesPolandPortugalRomaniaRussiaSaudi ArabiaScotlandSenegalSerbiaSierra LeoneSingaporeSomaliaSouth AfricaSouth AmericaSouth Central AsiaSouth Eastern AsiaSouthern EuropeSpainSri LankaSt. Vincent and the GrenadinesSudanSwedenSwitzerlandSyriaTaiwanThailandTrinidad and TobagoTurkeyUgandaUkraineUruguayUzbekistanVenezuelaVietnamWest IndiesWestern AfricaWestern AsiaWestern EuropeYemenZaireZimbabweAzores
Unemployment Among Ages 25 to 29 years
Income
Poverty
Unemployment
Labor Participation
Family Structure
Vehicle Availability
Education Level
Disability

Unemployment Among Ages 25 to 29 years Comparison

Ghanaians

Vietnamese

Tragic
Tragic
7.2%
UNEMPLOYMENT AMONG AGES 25 TO 29 YEARS
0.3/ 100
METRIC RATING
254th/ 347
METRIC RANK
7.6%
UNEMPLOYMENT AMONG AGES 25 TO 29 YEARS
0.0/ 100
METRIC RATING
286th/ 347
METRIC RANK

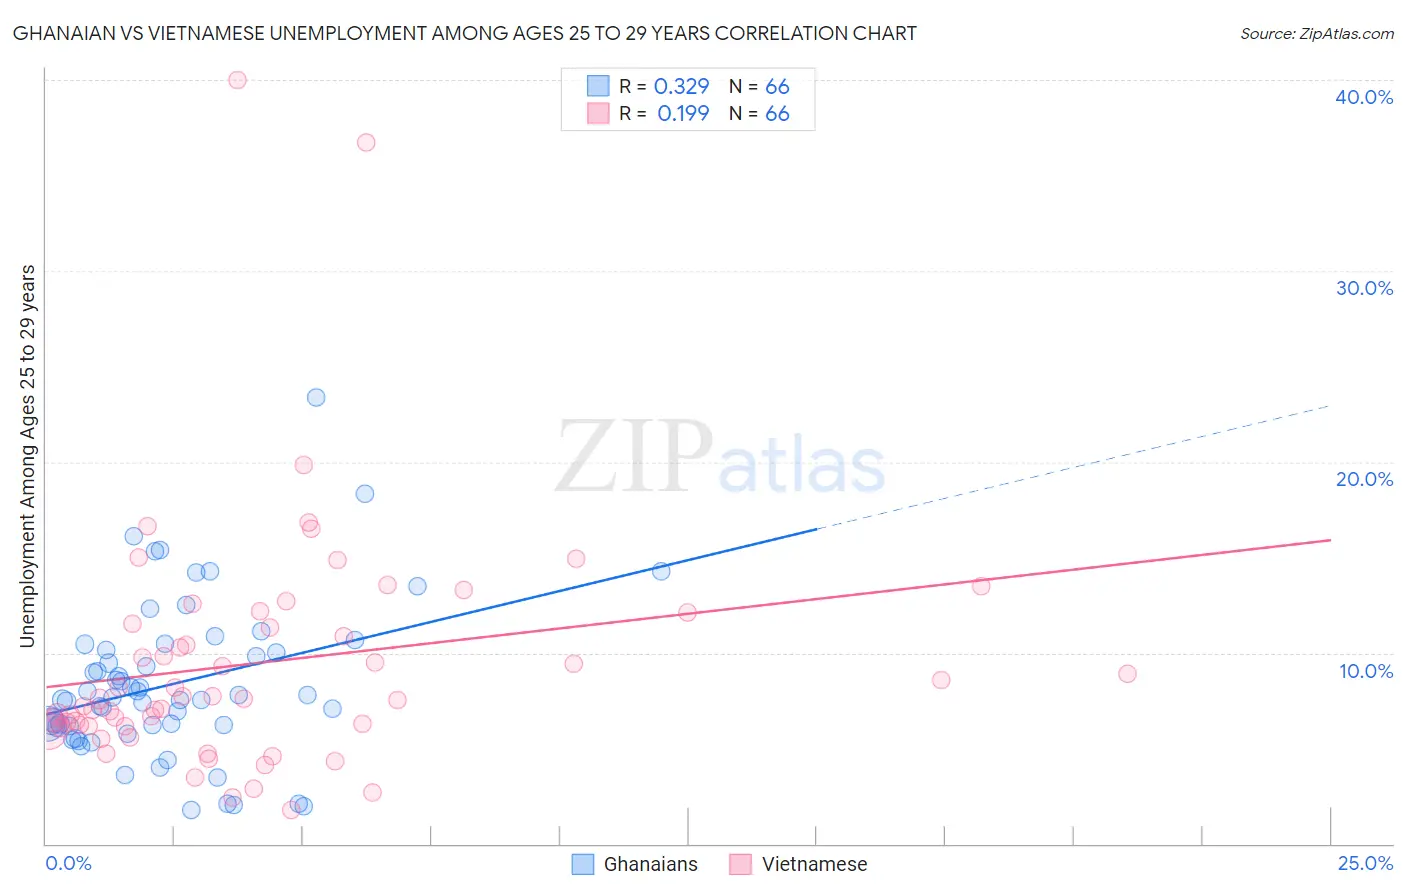
Ghanaian vs Vietnamese Unemployment Among Ages 25 to 29 years Correlation Chart

The statistical analysis conducted on geographies consisting of 187,167,021 people shows a mild positive correlation between the proportion of Ghanaians and unemployment rate among population between the ages 25 and 29 in the United States with a correlation coefficient (R) of 0.329 and weighted average of 7.2%. Similarly, the statistical analysis conducted on geographies consisting of 168,062,386 people shows a poor positive correlation between the proportion of Vietnamese and unemployment rate among population between the ages 25 and 29 in the United States with a correlation coefficient (R) of 0.199 and weighted average of 7.6%, a difference of 4.8%.
Ghanaian vs Vietnamese Unemployment Among Ages 25 to 29 years

Unemployment Among Ages 25 to 29 years Correlation Summary

MeasurementGhanaianVietnamese
Minimum1.8%1.8%
Maximum23.4%40.0%
Range21.6%38.2%
Mean8.4%9.5%
Median7.6%7.6%
Interquartile 25% (IQ1)6.2%6.2%
Interquartile 75% (IQ3)10.2%11.5%
Interquartile Range (IQR)4.0%5.4%
Standard Deviation (Sample)4.1%6.5%
Standard Deviation (Population)4.0%6.4%

Similar Demographics by Unemployment Among Ages 25 to 29 years

Demographics Similar to Ghanaians by Unemployment Among Ages 25 to 29 years

In terms of unemployment among ages 25 to 29 years, the demographic groups most similar to Ghanaians are Immigrants from Cameroon (7.2%, a difference of 0.060%), Immigrants from Portugal (7.2%, a difference of 0.15%), Mexican American Indian (7.3%, a difference of 0.26%), Sierra Leonean (7.2%, a difference of 0.47%), and Assyrian/Chaldean/Syriac (7.3%, a difference of 0.63%).
DemographicsRating | RankUnemployment Among Ages 25 to 29 years
Immigrants | Guatemala
0.7
/100
|
#247
Tragic
7.2%
Sub-Saharan Africans
0.6
/100
|
#248
Tragic
7.2%
Seminole
0.6
/100
|
#249
Tragic
7.2%
Delaware
0.5
/100
|
#250
Tragic
7.2%
Portuguese
0.5
/100
|
#251
Tragic
7.2%
Sierra Leoneans
0.4
/100
|
#252
Tragic
7.2%
Immigrants | Portugal
0.3
/100
|
#253
Tragic
7.2%
Ghanaians
0.3
/100
|
#254
Tragic
7.2%
Immigrants | Cameroon
0.3
/100
|
#255
Tragic
7.2%
Mexican American Indians
0.3
/100
|
#256
Tragic
7.3%
Assyrians/Chaldeans/Syriacs
0.2
/100
|
#257
Tragic
7.3%
Ottawa
0.1
/100
|
#258
Tragic
7.3%
Cree
0.1
/100
|
#259
Tragic
7.3%
Americans
0.1
/100
|
#260
Tragic
7.4%
Nigerians
0.1
/100
|
#261
Tragic
7.4%

Demographics Similar to Vietnamese by Unemployment Among Ages 25 to 29 years

In terms of unemployment among ages 25 to 29 years, the demographic groups most similar to Vietnamese are Senegalese (7.6%, a difference of 0.080%), Cherokee (7.6%, a difference of 0.21%), Creek (7.6%, a difference of 0.22%), Immigrants from Senegal (7.6%, a difference of 0.39%), and Immigrants from Bangladesh (7.5%, a difference of 0.56%).
DemographicsRating | RankUnemployment Among Ages 25 to 29 years
Nepalese
0.0
/100
|
#279
Tragic
7.5%
Immigrants | Caribbean
0.0
/100
|
#280
Tragic
7.5%
Immigrants | Bangladesh
0.0
/100
|
#281
Tragic
7.5%
Immigrants | Senegal
0.0
/100
|
#282
Tragic
7.6%
Creek
0.0
/100
|
#283
Tragic
7.6%
Cherokee
0.0
/100
|
#284
Tragic
7.6%
Senegalese
0.0
/100
|
#285
Tragic
7.6%
Vietnamese
0.0
/100
|
#286
Tragic
7.6%
Immigrants | Mexico
0.0
/100
|
#287
Tragic
7.6%
Africans
0.0
/100
|
#288
Tragic
7.6%
Belizeans
0.0
/100
|
#289
Tragic
7.7%
Armenians
0.0
/100
|
#290
Tragic
7.7%
Hispanics or Latinos
0.0
/100
|
#291
Tragic
7.7%
Chippewa
0.0
/100
|
#292
Tragic
7.8%
Immigrants | Belize
0.0
/100
|
#293
Tragic
7.8%