Ghanaian vs Swedish Unemployment Among Youth under 25 years

COMPARE

Ghanaian
Race
Ancestry
AfghanAfricanAlaska NativeAlaskan AthabascanAlbanianAleutAlsatianAmericanApacheArabArapahoArgentineanArmenianAssyrian/Chaldean/SyriacAustralianAustrianBahamianBangladeshiBarbadianBasqueBelgianBelizeanBermudanBhutaneseBlackfeetBolivianBrazilianBritishBritish West IndianBulgarianBurmeseCajunCambodianCanadianCape VerdeanCarpatho RusynCelticCentral AmericanCentral American IndianCherokeeCheyenneChickasawChileanChineseChippewaChoctawColombianColvilleComancheCosta RicanCreeCreekCroatianCrowCubanCypriotCzechCzechoslovakianDanishDelawareDominicanDutchDutch West IndianEastern EuropeanEcuadorianEgyptianEnglishEstonianEthiopianEuropeanFijianFilipinoFinnishFrenchFrench American IndianFrench CanadianGermanGerman RussianGhanaianGreekGuamanian/ChamorroGuatemalanGuyaneseHaitianHmongHonduranHopiHoumaHungarianIcelanderIndian (Asian)IndonesianInupiatIranianIraqiIrishIroquoisIsraeliItalianJamaicanJapaneseJordanianKenyanKiowaKoreanLaotianLatvianLebaneseLiberianLithuanianLumbeeLuxembourgerMacedonianMalaysianMalteseMarshalleseMenomineeMexicanMexican American IndianMongolianMoroccanNative HawaiianNavajoNepaleseNew ZealanderNicaraguanNigerianNorthern EuropeanNorwegianOkinawanOsageOttawaPaiutePakistaniPalestinianPanamanianParaguayanPennsylvania GermanPeruvianPimaPolishPortuguesePotawatomiPuebloPuerto RicanPuget Sound SalishRomanianRussianSalvadoranSamoanScandinavianScotch-IrishScottishSeminoleSenegaleseSerbianShoshoneSierra LeoneanSiouxSlavicSlovakSloveneSomaliSouth AfricanSouth AmericanSouth American IndianSoviet UnionSpaniardSpanishSpanish AmericanSpanish American IndianSri LankanSubsaharan AfricanSudaneseSwissSyrianTaiwaneseThaiTlingit-HaidaTohono O'OdhamTonganTrinidadian and TobagonianTsimshianTurkishU.S. Virgin IslanderUgandanUkrainianUruguayanUteVenezuelanVietnameseWelshWest IndianYakamaYaquiYugoslavianYumanYup'ikZimbabwean
Immigration
NonimmigrantsImmigrantsAfghanistanAfricaAlbaniaArgentinaArmeniaAsiaAustraliaAustriaBahamasBangladeshBarbadosBelarusBelgiumBelizeBoliviaBosnia and HerzegovinaBrazilBulgariaBurma/MyanmarCabo VerdeCambodiaCameroonCanadaCaribbeanCentral AmericaChileChinaColombiaCongoCosta RicaCroatiaCubaCzechoslovakiaDenmarkDominicaDominican RepublicEastern AfricaEastern AsiaEastern EuropeEcuadorEgyptEl SalvadorEnglandEritreaEthiopiaEuropeFijiFranceGermanyGhanaGreeceGrenadaGuatemalaGuyanaHaitiHondurasHong KongHungaryIndiaIndonesiaIranIraqIrelandIsraelItalyJamaicaJapanJordanKazakhstanKenyaKoreaKuwaitLaosLatin AmericaLatviaLebanonLiberiaLithuaniaMalaysiaMexicoMicronesiaMiddle AfricaMoldovaMoroccoNepalNetherlandsNicaraguaNigeriaNorth AmericaNorth MacedoniaNorthern AfricaNorthern EuropeNorwayOceaniaPakistanPanamaPeruPhilippinesPolandPortugalRomaniaRussiaSaudi ArabiaScotlandSenegalSerbiaSierra LeoneSingaporeSomaliaSouth AfricaSouth AmericaSouth Central AsiaSouth Eastern AsiaSouthern EuropeSpainSri LankaSt. Vincent and the GrenadinesSudanSwedenSwitzerlandSyriaTaiwanThailandTrinidad and TobagoTurkeyUgandaUkraineUruguayUzbekistanVenezuelaVietnamWest IndiesWestern AfricaWestern AsiaWestern EuropeYemenZaireZimbabweAzores
Swedish
Race
Ancestry
AfghanAfricanAlaska NativeAlaskan AthabascanAlbanianAleutAlsatianAmericanApacheArabArapahoArgentineanArmenianAssyrian/Chaldean/SyriacAustralianAustrianBahamianBangladeshiBarbadianBasqueBelgianBelizeanBermudanBhutaneseBlackfeetBolivianBrazilianBritishBritish West IndianBulgarianBurmeseCajunCambodianCanadianCape VerdeanCarpatho RusynCelticCentral AmericanCentral American IndianCherokeeCheyenneChickasawChileanChineseChippewaChoctawColombianColvilleComancheCosta RicanCreeCreekCroatianCrowCubanCypriotCzechCzechoslovakianDanishDelawareDominicanDutchDutch West IndianEastern EuropeanEcuadorianEgyptianEnglishEstonianEthiopianEuropeanFijianFilipinoFinnishFrenchFrench American IndianFrench CanadianGermanGerman RussianGreekGuamanian/ChamorroGuatemalanGuyaneseHaitianHmongHonduranHopiHoumaHungarianIcelanderIndian (Asian)IndonesianInupiatIranianIraqiIrishIroquoisIsraeliItalianJamaicanJapaneseJordanianKenyanKiowaKoreanLaotianLatvianLebaneseLiberianLithuanianLumbeeLuxembourgerMacedonianMalaysianMalteseMarshalleseMenomineeMexicanMexican American IndianMongolianMoroccanNative HawaiianNavajoNepaleseNew ZealanderNicaraguanNigerianNorthern EuropeanNorwegianOkinawanOsageOttawaPaiutePakistaniPalestinianPanamanianParaguayanPennsylvania GermanPeruvianPimaPolishPortuguesePotawatomiPuebloPuerto RicanPuget Sound SalishRomanianRussianSalvadoranSamoanScandinavianScotch-IrishScottishSeminoleSenegaleseSerbianShoshoneSierra LeoneanSiouxSlavicSlovakSloveneSomaliSouth AfricanSouth AmericanSouth American IndianSoviet UnionSpaniardSpanishSpanish AmericanSpanish American IndianSri LankanSubsaharan AfricanSudaneseSwedishSwissSyrianTaiwaneseThaiTlingit-HaidaTohono O'OdhamTonganTrinidadian and TobagonianTsimshianTurkishU.S. Virgin IslanderUgandanUkrainianUruguayanUteVenezuelanVietnameseWelshWest IndianYakamaYaquiYugoslavianYumanYup'ikZimbabwean
Immigration
NonimmigrantsImmigrantsAfghanistanAfricaAlbaniaArgentinaArmeniaAsiaAustraliaAustriaBahamasBangladeshBarbadosBelarusBelgiumBelizeBoliviaBosnia and HerzegovinaBrazilBulgariaBurma/MyanmarCabo VerdeCambodiaCameroonCanadaCaribbeanCentral AmericaChileChinaColombiaCongoCosta RicaCroatiaCubaCzechoslovakiaDenmarkDominicaDominican RepublicEastern AfricaEastern AsiaEastern EuropeEcuadorEgyptEl SalvadorEnglandEritreaEthiopiaEuropeFijiFranceGermanyGhanaGreeceGrenadaGuatemalaGuyanaHaitiHondurasHong KongHungaryIndiaIndonesiaIranIraqIrelandIsraelItalyJamaicaJapanJordanKazakhstanKenyaKoreaKuwaitLaosLatin AmericaLatviaLebanonLiberiaLithuaniaMalaysiaMexicoMicronesiaMiddle AfricaMoldovaMoroccoNepalNetherlandsNicaraguaNigeriaNorth AmericaNorth MacedoniaNorthern AfricaNorthern EuropeNorwayOceaniaPakistanPanamaPeruPhilippinesPolandPortugalRomaniaRussiaSaudi ArabiaScotlandSenegalSerbiaSierra LeoneSingaporeSomaliaSouth AfricaSouth AmericaSouth Central AsiaSouth Eastern AsiaSouthern EuropeSpainSri LankaSt. Vincent and the GrenadinesSudanSwedenSwitzerlandSyriaTaiwanThailandTrinidad and TobagoTurkeyUgandaUkraineUruguayUzbekistanVenezuelaVietnamWest IndiesWestern AfricaWestern AsiaWestern EuropeYemenZaireZimbabweAzores
Unemployment Among Youth under 25 years
Income
Poverty
Unemployment
Labor Participation
Family Structure
Vehicle Availability
Education Level
Disability

Unemployment Among Youth under 25 years Comparison

Ghanaians

Swedes

Tragic
Exceptional
13.3%
UNEMPLOYMENT AMONG YOUTH UNDER 25 YEARS
0.0/ 100
METRIC RATING
285th/ 347
METRIC RANK
10.4%
UNEMPLOYMENT AMONG YOUTH UNDER 25 YEARS
100.0/ 100
METRIC RATING
7th/ 347
METRIC RANK

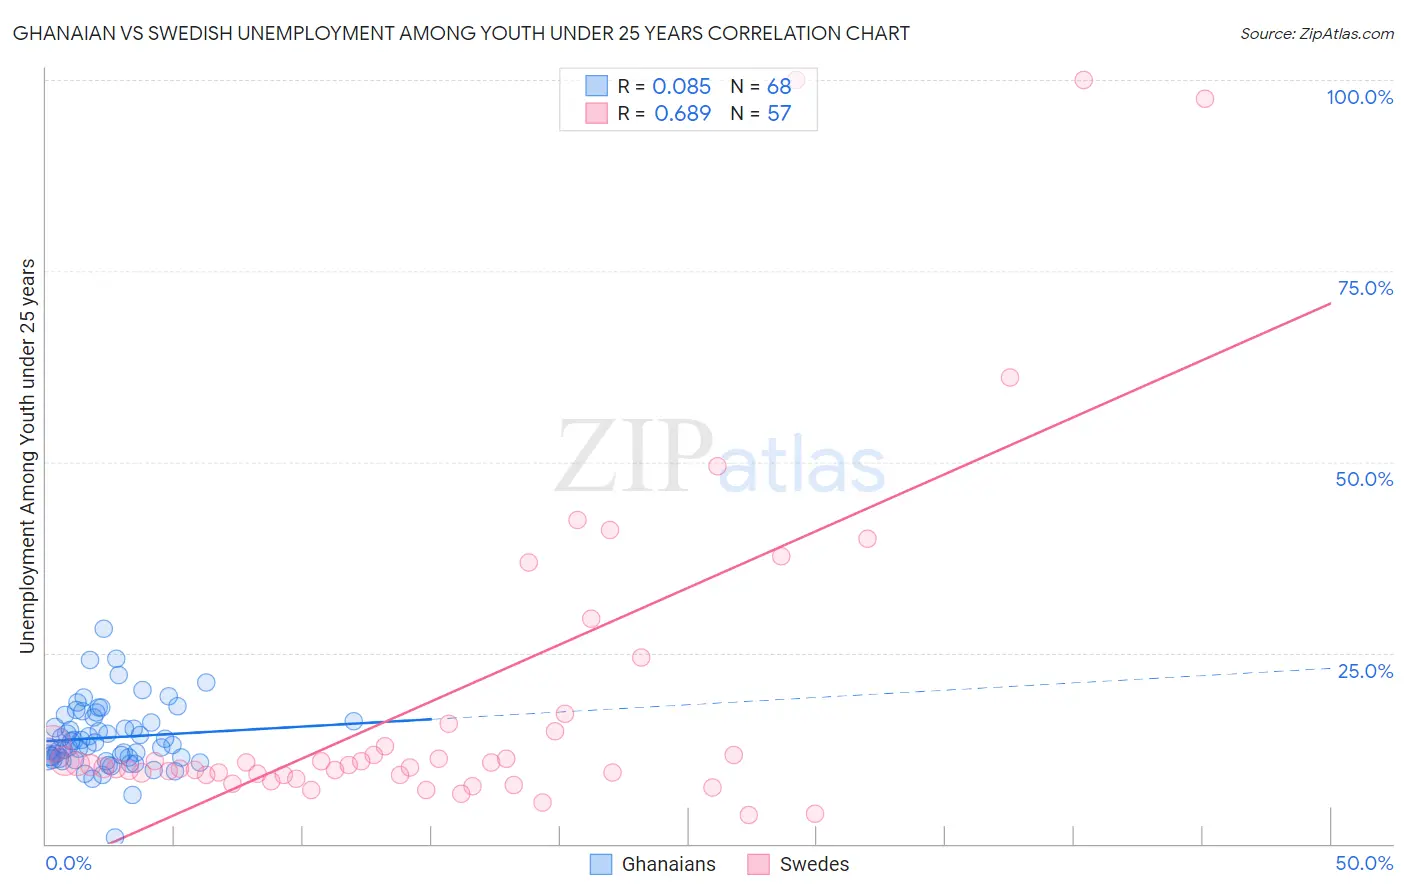
Ghanaian vs Swedish Unemployment Among Youth under 25 years Correlation Chart

The statistical analysis conducted on geographies consisting of 190,112,993 people shows a slight positive correlation between the proportion of Ghanaians and unemployment rate among youth under the age of 25 in the United States with a correlation coefficient (R) of 0.085 and weighted average of 13.3%. Similarly, the statistical analysis conducted on geographies consisting of 519,578,376 people shows a significant positive correlation between the proportion of Swedes and unemployment rate among youth under the age of 25 in the United States with a correlation coefficient (R) of 0.689 and weighted average of 10.4%, a difference of 28.0%.
Ghanaian vs Swedish Unemployment Among Youth under 25 years

Unemployment Among Youth under 25 years Correlation Summary

MeasurementGhanaianSwedish
Minimum0.90%3.8%
Maximum28.2%100.0%
Range27.3%96.2%
Mean13.9%19.3%
Median13.1%10.3%
Interquartile 25% (IQ1)11.3%9.0%
Interquartile 75% (IQ3)16.3%15.2%
Interquartile Range (IQR)5.1%6.2%
Standard Deviation (Sample)4.4%22.5%
Standard Deviation (Population)4.3%22.3%

Similar Demographics by Unemployment Among Youth under 25 years

Demographics Similar to Ghanaians by Unemployment Among Youth under 25 years

In terms of unemployment among youth under 25 years, the demographic groups most similar to Ghanaians are Blackfeet (13.3%, a difference of 0.050%), Ecuadorian (13.3%, a difference of 0.060%), Lumbee (13.3%, a difference of 0.090%), Immigrants from Cameroon (13.3%, a difference of 0.10%), and Sierra Leonean (13.3%, a difference of 0.12%).
DemographicsRating | RankUnemployment Among Youth under 25 years
Africans
0.0
/100
|
#278
Tragic
13.2%
Cajuns
0.0
/100
|
#279
Tragic
13.2%
Ute
0.0
/100
|
#280
Tragic
13.3%
Armenians
0.0
/100
|
#281
Tragic
13.3%
Sierra Leoneans
0.0
/100
|
#282
Tragic
13.3%
Immigrants | Cameroon
0.0
/100
|
#283
Tragic
13.3%
Lumbee
0.0
/100
|
#284
Tragic
13.3%
Ghanaians
0.0
/100
|
#285
Tragic
13.3%
Blackfeet
0.0
/100
|
#286
Tragic
13.3%
Ecuadorians
0.0
/100
|
#287
Tragic
13.3%
Immigrants | Western Africa
0.0
/100
|
#288
Tragic
13.4%
Immigrants | Ghana
0.0
/100
|
#289
Tragic
13.4%
Immigrants | Ecuador
0.0
/100
|
#290
Tragic
13.4%
Apache
0.0
/100
|
#291
Tragic
13.5%
Central American Indians
0.0
/100
|
#292
Tragic
13.5%

Demographics Similar to Swedes by Unemployment Among Youth under 25 years

In terms of unemployment among youth under 25 years, the demographic groups most similar to Swedes are Danish (10.3%, a difference of 0.75%), Immigrants from Venezuela (10.5%, a difference of 0.78%), Czech (10.3%, a difference of 0.91%), German (10.5%, a difference of 1.2%), and Immigrants from Somalia (10.5%, a difference of 1.2%).
DemographicsRating | RankUnemployment Among Youth under 25 years
Norwegians
100.0
/100
|
#1
Exceptional
9.8%
Immigrants | Cuba
100.0
/100
|
#2
Exceptional
10.0%
Luxembourgers
100.0
/100
|
#3
Exceptional
10.0%
Zimbabweans
100.0
/100
|
#4
Exceptional
10.2%
Czechs
100.0
/100
|
#5
Exceptional
10.3%
Danes
100.0
/100
|
#6
Exceptional
10.3%
Swedes
100.0
/100
|
#7
Exceptional
10.4%
Immigrants | Venezuela
100.0
/100
|
#8
Exceptional
10.5%
Germans
100.0
/100
|
#9
Exceptional
10.5%
Immigrants | Somalia
100.0
/100
|
#10
Exceptional
10.5%
Scandinavians
100.0
/100
|
#11
Exceptional
10.5%
Immigrants | Sudan
100.0
/100
|
#12
Exceptional
10.5%
Indonesians
100.0
/100
|
#13
Exceptional
10.6%
Cubans
100.0
/100
|
#14
Exceptional
10.6%
Sudanese
100.0
/100
|
#15
Exceptional
10.6%