French vs Danish Unemployment Among Ages 20 to 24 years

COMPARE

French
Race
Ancestry
AfghanAfricanAlaska NativeAlaskan AthabascanAlbanianAleutAlsatianAmericanApacheArabArapahoArgentineanArmenianAssyrian/Chaldean/SyriacAustralianAustrianBahamianBangladeshiBarbadianBasqueBelgianBelizeanBermudanBhutaneseBlackfeetBolivianBrazilianBritishBritish West IndianBulgarianBurmeseCajunCambodianCanadianCape VerdeanCarpatho RusynCelticCentral AmericanCentral American IndianCherokeeCheyenneChickasawChileanChineseChippewaChoctawColombianColvilleComancheCosta RicanCreeCreekCroatianCrowCubanCypriotCzechCzechoslovakianDelawareDominicanDutchDutch West IndianEastern EuropeanEcuadorianEgyptianEnglishEstonianEthiopianEuropeanFijianFilipinoFinnishFrenchFrench American IndianFrench CanadianGermanGerman RussianGhanaianGreekGuamanian/ChamorroGuatemalanGuyaneseHaitianHmongHonduranHopiHoumaHungarianIcelanderIndian (Asian)IndonesianInupiatIranianIraqiIrishIroquoisIsraeliItalianJamaicanJapaneseJordanianKenyanKiowaKoreanLaotianLatvianLebaneseLiberianLithuanianLumbeeLuxembourgerMacedonianMalaysianMalteseMarshalleseMenomineeMexicanMexican American IndianMongolianMoroccanNative HawaiianNavajoNepaleseNew ZealanderNicaraguanNigerianNorthern EuropeanNorwegianOkinawanOsageOttawaPaiutePakistaniPalestinianPanamanianParaguayanPennsylvania GermanPeruvianPimaPolishPortuguesePotawatomiPuebloPuerto RicanPuget Sound SalishRomanianRussianSalvadoranSamoanScandinavianScotch-IrishScottishSeminoleSenegaleseSerbianShoshoneSierra LeoneanSiouxSlavicSlovakSloveneSomaliSouth AfricanSouth AmericanSouth American IndianSoviet UnionSpaniardSpanishSpanish AmericanSpanish American IndianSri LankanSubsaharan AfricanSudaneseSwedishSwissSyrianTaiwaneseThaiTlingit-HaidaTohono O'OdhamTonganTrinidadian and TobagonianTsimshianTurkishU.S. Virgin IslanderUgandanUkrainianUruguayanUteVenezuelanVietnameseWelshWest IndianYakamaYaquiYugoslavianYumanYup'ikZimbabwean
Immigration
NonimmigrantsImmigrantsAfghanistanAfricaAlbaniaArgentinaArmeniaAsiaAustraliaAustriaBahamasBangladeshBarbadosBelarusBelgiumBelizeBoliviaBosnia and HerzegovinaBrazilBulgariaBurma/MyanmarCabo VerdeCambodiaCameroonCanadaCaribbeanCentral AmericaChileChinaColombiaCongoCosta RicaCroatiaCubaCzechoslovakiaDenmarkDominicaDominican RepublicEastern AfricaEastern AsiaEastern EuropeEcuadorEgyptEl SalvadorEnglandEritreaEthiopiaEuropeFijiFranceGermanyGhanaGreeceGrenadaGuatemalaGuyanaHaitiHondurasHong KongHungaryIndiaIndonesiaIranIraqIrelandIsraelItalyJamaicaJapanJordanKazakhstanKenyaKoreaKuwaitLaosLatin AmericaLatviaLebanonLiberiaLithuaniaMalaysiaMexicoMicronesiaMiddle AfricaMoldovaMoroccoNepalNetherlandsNicaraguaNigeriaNorth AmericaNorth MacedoniaNorthern AfricaNorthern EuropeNorwayOceaniaPakistanPanamaPeruPhilippinesPolandPortugalRomaniaRussiaSaudi ArabiaScotlandSenegalSerbiaSierra LeoneSingaporeSomaliaSouth AfricaSouth AmericaSouth Central AsiaSouth Eastern AsiaSouthern EuropeSpainSri LankaSt. Vincent and the GrenadinesSudanSwedenSwitzerlandSyriaTaiwanThailandTrinidad and TobagoTurkeyUgandaUkraineUruguayUzbekistanVenezuelaVietnamWest IndiesWestern AfricaWestern AsiaWestern EuropeYemenZaireZimbabweAzores
Danish
Race
Ancestry
AfghanAfricanAlaska NativeAlaskan AthabascanAlbanianAleutAlsatianAmericanApacheArabArapahoArgentineanArmenianAssyrian/Chaldean/SyriacAustralianAustrianBahamianBangladeshiBarbadianBasqueBelgianBelizeanBermudanBhutaneseBlackfeetBolivianBrazilianBritishBritish West IndianBulgarianBurmeseCajunCambodianCanadianCape VerdeanCarpatho RusynCelticCentral AmericanCentral American IndianCherokeeCheyenneChickasawChileanChineseChippewaChoctawColombianColvilleComancheCosta RicanCreeCreekCroatianCrowCubanCypriotCzechCzechoslovakianDanishDelawareDominicanDutchDutch West IndianEastern EuropeanEcuadorianEgyptianEnglishEstonianEthiopianEuropeanFijianFilipinoFinnishFrench American IndianFrench CanadianGermanGerman RussianGhanaianGreekGuamanian/ChamorroGuatemalanGuyaneseHaitianHmongHonduranHopiHoumaHungarianIcelanderIndian (Asian)IndonesianInupiatIranianIraqiIrishIroquoisIsraeliItalianJamaicanJapaneseJordanianKenyanKiowaKoreanLaotianLatvianLebaneseLiberianLithuanianLumbeeLuxembourgerMacedonianMalaysianMalteseMarshalleseMenomineeMexicanMexican American IndianMongolianMoroccanNative HawaiianNavajoNepaleseNew ZealanderNicaraguanNigerianNorthern EuropeanNorwegianOkinawanOsageOttawaPaiutePakistaniPalestinianPanamanianParaguayanPennsylvania GermanPeruvianPimaPolishPortuguesePotawatomiPuebloPuerto RicanPuget Sound SalishRomanianRussianSalvadoranSamoanScandinavianScotch-IrishScottishSeminoleSenegaleseSerbianShoshoneSierra LeoneanSiouxSlavicSlovakSloveneSomaliSouth AfricanSouth AmericanSouth American IndianSoviet UnionSpaniardSpanishSpanish AmericanSpanish American IndianSri LankanSubsaharan AfricanSudaneseSwedishSwissSyrianTaiwaneseThaiTlingit-HaidaTohono O'OdhamTonganTrinidadian and TobagonianTsimshianTurkishU.S. Virgin IslanderUgandanUkrainianUruguayanUteVenezuelanVietnameseWelshWest IndianYakamaYaquiYugoslavianYumanYup'ikZimbabwean
Immigration
NonimmigrantsImmigrantsAfghanistanAfricaAlbaniaArgentinaArmeniaAsiaAustraliaAustriaBahamasBangladeshBarbadosBelarusBelgiumBelizeBoliviaBosnia and HerzegovinaBrazilBulgariaBurma/MyanmarCabo VerdeCambodiaCameroonCanadaCaribbeanCentral AmericaChileChinaColombiaCongoCosta RicaCroatiaCubaCzechoslovakiaDenmarkDominicaDominican RepublicEastern AfricaEastern AsiaEastern EuropeEcuadorEgyptEl SalvadorEnglandEritreaEthiopiaEuropeFijiFranceGermanyGhanaGreeceGrenadaGuatemalaGuyanaHaitiHondurasHong KongHungaryIndiaIndonesiaIranIraqIrelandIsraelItalyJamaicaJapanJordanKazakhstanKenyaKoreaKuwaitLaosLatin AmericaLatviaLebanonLiberiaLithuaniaMalaysiaMexicoMicronesiaMiddle AfricaMoldovaMoroccoNepalNetherlandsNicaraguaNigeriaNorth AmericaNorth MacedoniaNorthern AfricaNorthern EuropeNorwayOceaniaPakistanPanamaPeruPhilippinesPolandPortugalRomaniaRussiaSaudi ArabiaScotlandSenegalSerbiaSierra LeoneSingaporeSomaliaSouth AfricaSouth AmericaSouth Central AsiaSouth Eastern AsiaSouthern EuropeSpainSri LankaSt. Vincent and the GrenadinesSudanSwedenSwitzerlandSyriaTaiwanThailandTrinidad and TobagoTurkeyUgandaUkraineUruguayUzbekistanVenezuelaVietnamWest IndiesWestern AfricaWestern AsiaWestern EuropeYemenZaireZimbabweAzores
Unemployment Among Ages 20 to 24 years
Income
Poverty
Unemployment
Labor Participation
Family Structure
Vehicle Availability
Education Level
Disability

Unemployment Among Ages 20 to 24 years Comparison

French

Danes

Excellent
Exceptional
10.1%
UNEMPLOYMENT AMONG AGES 20 TO 24 YEARS
88.2/ 100
METRIC RATING
119th/ 347
METRIC RANK
9.3%
UNEMPLOYMENT AMONG AGES 20 TO 24 YEARS
100.0/ 100
METRIC RATING
16th/ 347
METRIC RANK

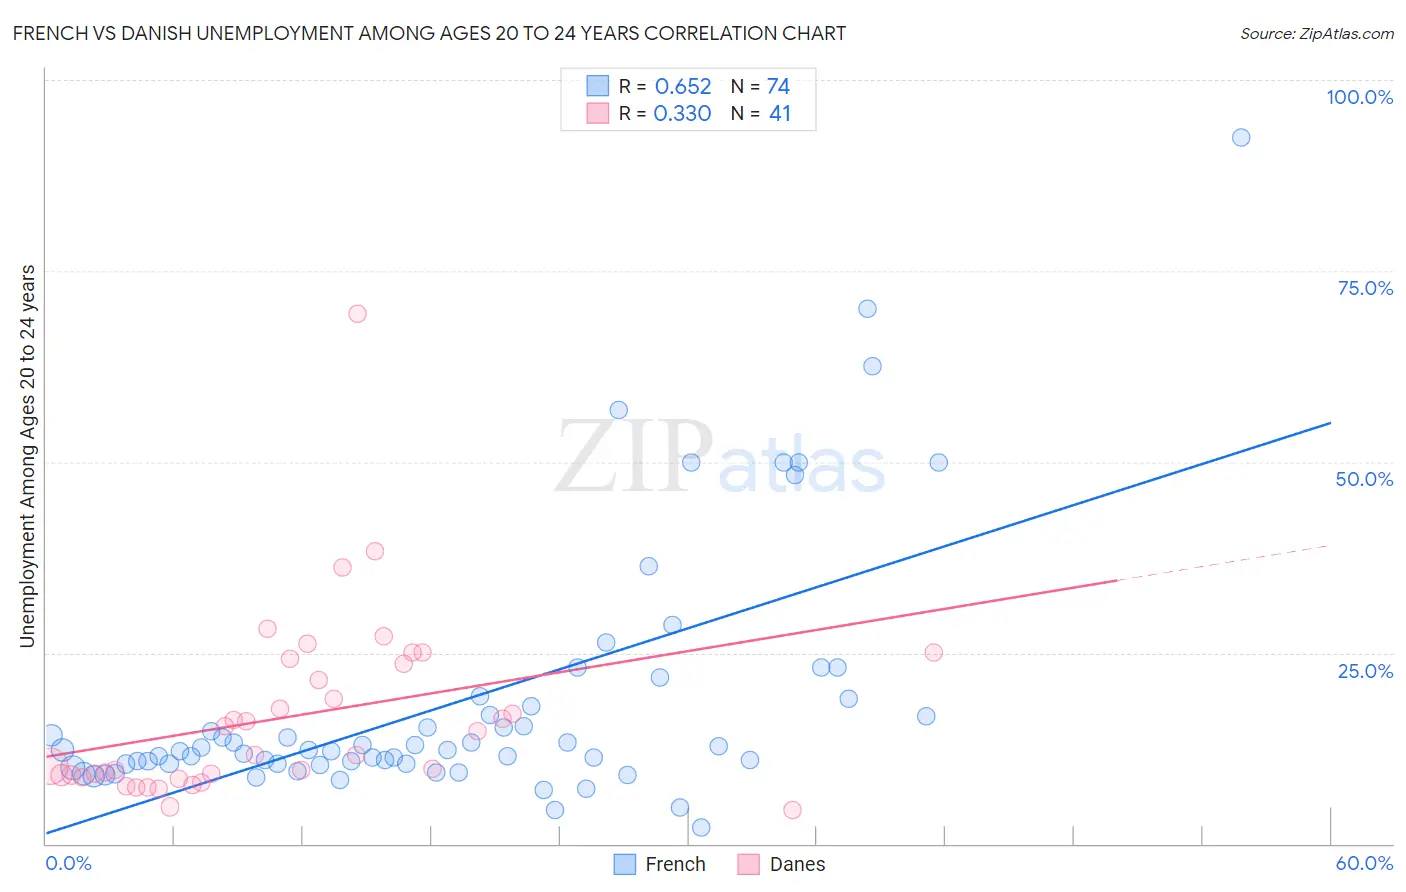
French vs Danish Unemployment Among Ages 20 to 24 years Correlation Chart

The statistical analysis conducted on geographies consisting of 523,708,435 people shows a significant positive correlation between the proportion of French and unemployment rate among population between the ages 20 and 24 in the United States with a correlation coefficient (R) of 0.652 and weighted average of 10.1%. Similarly, the statistical analysis conducted on geographies consisting of 447,112,661 people shows a mild positive correlation between the proportion of Danes and unemployment rate among population between the ages 20 and 24 in the United States with a correlation coefficient (R) of 0.330 and weighted average of 9.3%, a difference of 9.0%.
French vs Danish Unemployment Among Ages 20 to 24 years

Unemployment Among Ages 20 to 24 years Correlation Summary

MeasurementFrenchDanish
Minimum2.1%4.5%
Maximum92.5%69.4%
Range90.4%64.9%
Mean18.6%16.6%
Median12.2%11.6%
Interquartile 25% (IQ1)10.5%8.9%
Interquartile 75% (IQ3)18.0%23.9%
Interquartile Range (IQR)7.6%15.1%
Standard Deviation (Sample)16.7%12.0%
Standard Deviation (Population)16.6%11.8%

Similar Demographics by Unemployment Among Ages 20 to 24 years

Demographics Similar to French by Unemployment Among Ages 20 to 24 years

In terms of unemployment among ages 20 to 24 years, the demographic groups most similar to French are Immigrants from Canada (10.1%, a difference of 0.0%), Paraguayan (10.1%, a difference of 0.030%), South African (10.1%, a difference of 0.040%), White/Caucasian (10.1%, a difference of 0.080%), and Immigrants from Iraq (10.1%, a difference of 0.10%).
DemographicsRating | RankUnemployment Among Ages 20 to 24 years
Northern Europeans
92.7
/100
|
#112
Exceptional
10.1%
German Russians
92.4
/100
|
#113
Exceptional
10.1%
Ottawa
90.8
/100
|
#114
Exceptional
10.1%
Immigrants | Morocco
90.5
/100
|
#115
Exceptional
10.1%
Basques
89.8
/100
|
#116
Excellent
10.1%
Immigrants | Uruguay
89.6
/100
|
#117
Excellent
10.1%
Paraguayans
88.6
/100
|
#118
Excellent
10.1%
French
88.2
/100
|
#119
Excellent
10.1%
Immigrants | Canada
88.2
/100
|
#120
Excellent
10.1%
South Africans
87.8
/100
|
#121
Excellent
10.1%
Whites/Caucasians
87.4
/100
|
#122
Excellent
10.1%
Immigrants | Iraq
87.1
/100
|
#123
Excellent
10.1%
Immigrants | Japan
86.5
/100
|
#124
Excellent
10.1%
Spanish
86.1
/100
|
#125
Excellent
10.1%
Jordanians
86.1
/100
|
#126
Excellent
10.1%

Demographics Similar to Danes by Unemployment Among Ages 20 to 24 years

In terms of unemployment among ages 20 to 24 years, the demographic groups most similar to Danes are Immigrants from Sudan (9.3%, a difference of 0.16%), Slovene (9.3%, a difference of 0.19%), Czech (9.3%, a difference of 0.51%), Immigrants from Congo (9.2%, a difference of 0.57%), and Cuban (9.2%, a difference of 0.65%).
DemographicsRating | RankUnemployment Among Ages 20 to 24 years
Immigrants | Somalia
100.0
/100
|
#9
Exceptional
9.2%
Sudanese
100.0
/100
|
#10
Exceptional
9.2%
Zimbabweans
100.0
/100
|
#11
Exceptional
9.2%
Cubans
100.0
/100
|
#12
Exceptional
9.2%
Immigrants | Congo
100.0
/100
|
#13
Exceptional
9.2%
Slovenes
100.0
/100
|
#14
Exceptional
9.3%
Immigrants | Sudan
100.0
/100
|
#15
Exceptional
9.3%
Danes
100.0
/100
|
#16
Exceptional
9.3%
Czechs
100.0
/100
|
#17
Exceptional
9.3%
Chinese
100.0
/100
|
#18
Exceptional
9.4%
Hmong
100.0
/100
|
#19
Exceptional
9.4%
Osage
100.0
/100
|
#20
Exceptional
9.4%
Immigrants | Bosnia and Herzegovina
100.0
/100
|
#21
Exceptional
9.4%
Tongans
100.0
/100
|
#22
Exceptional
9.4%
Immigrants | Nepal
100.0
/100
|
#23
Exceptional
9.4%