French American Indian vs German Male Unemployment
COMPARE
French American Indian
German
Male Unemployment
Male Unemployment Comparison
French American Indians
Germans
5.9%
MALE UNEMPLOYMENT
0.0/ 100
METRIC RATING
265th/ 347
METRIC RANK
4.7%
MALE UNEMPLOYMENT
100.0/ 100
METRIC RATING
14th/ 347
METRIC RANK
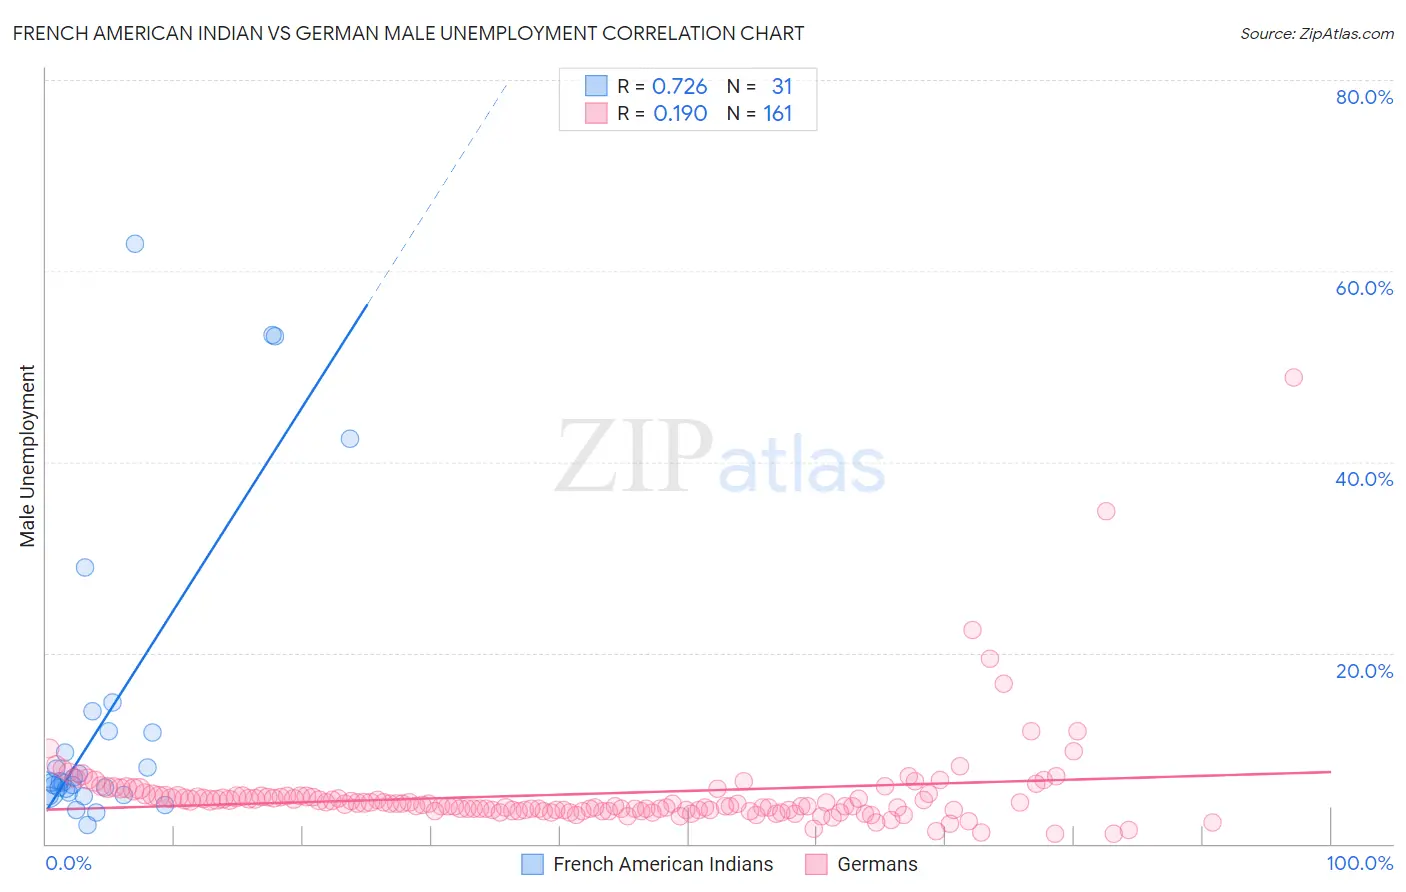
French American Indian vs German Male Unemployment Correlation Chart
The statistical analysis conducted on geographies consisting of 131,648,620 people shows a strong positive correlation between the proportion of French American Indians and unemployment rate among males in the United States with a correlation coefficient (R) of 0.726 and weighted average of 5.9%. Similarly, the statistical analysis conducted on geographies consisting of 567,520,747 people shows a poor positive correlation between the proportion of Germans and unemployment rate among males in the United States with a correlation coefficient (R) of 0.190 and weighted average of 4.7%, a difference of 25.9%.
Male Unemployment Correlation Summary
| Measurement | French American Indian | German |
| Minimum | 1.9% | 1.1% |
| Maximum | 62.9% | 48.9% |
| Range | 61.0% | 47.8% |
| Mean | 13.6% | 5.2% |
| Median | 6.4% | 4.2% |
| Interquartile 25% (IQ1) | 5.4% | 3.5% |
| Interquartile 75% (IQ3) | 11.8% | 4.9% |
| Interquartile Range (IQR) | 6.4% | 1.4% |
| Standard Deviation (Sample) | 16.4% | 5.0% |
| Standard Deviation (Population) | 16.1% | 5.0% |
Similar Demographics by Male Unemployment
Demographics Similar to French American Indians by Male Unemployment
In terms of male unemployment, the demographic groups most similar to French American Indians are Bahamian (5.9%, a difference of 0.14%), Nigerian (5.9%, a difference of 0.26%), Immigrants from Mexico (5.9%, a difference of 0.39%), Bermudan (5.9%, a difference of 0.47%), and Immigrants from Latin America (5.9%, a difference of 0.61%).
| Demographics | Rating | Rank | Male Unemployment |
| Dutch West Indians | 0.1 /100 | #258 | Tragic 5.8% |
| Cajuns | 0.1 /100 | #259 | Tragic 5.8% |
| Immigrants | Central America | 0.1 /100 | #260 | Tragic 5.8% |
| Liberians | 0.1 /100 | #261 | Tragic 5.8% |
| Immigrants | Portugal | 0.1 /100 | #262 | Tragic 5.9% |
| Immigrants | Latin America | 0.1 /100 | #263 | Tragic 5.9% |
| Immigrants | Mexico | 0.0 /100 | #264 | Tragic 5.9% |
| French American Indians | 0.0 /100 | #265 | Tragic 5.9% |
| Bahamians | 0.0 /100 | #266 | Tragic 5.9% |
| Nigerians | 0.0 /100 | #267 | Tragic 5.9% |
| Bermudans | 0.0 /100 | #268 | Tragic 5.9% |
| Immigrants | Nigeria | 0.0 /100 | #269 | Tragic 6.0% |
| Sub-Saharan Africans | 0.0 /100 | #270 | Tragic 6.0% |
| Blackfeet | 0.0 /100 | #271 | Tragic 6.0% |
| Immigrants | Uzbekistan | 0.0 /100 | #272 | Tragic 6.0% |
Demographics Similar to Germans by Male Unemployment
In terms of male unemployment, the demographic groups most similar to Germans are Bolivian (4.7%, a difference of 0.020%), Scandinavian (4.7%, a difference of 0.27%), Swiss (4.7%, a difference of 0.32%), Immigrants from Bolivia (4.7%, a difference of 0.70%), and Filipino (4.7%, a difference of 1.1%).
| Demographics | Rating | Rank | Male Unemployment |
| Czechs | 100.0 /100 | #7 | Exceptional 4.5% |
| Luxembourgers | 100.0 /100 | #8 | Exceptional 4.5% |
| Thais | 100.0 /100 | #9 | Exceptional 4.6% |
| Cubans | 100.0 /100 | #10 | Exceptional 4.6% |
| Swedes | 100.0 /100 | #11 | Exceptional 4.6% |
| Immigrants | Bolivia | 100.0 /100 | #12 | Exceptional 4.7% |
| Bolivians | 100.0 /100 | #13 | Exceptional 4.7% |
| Germans | 100.0 /100 | #14 | Exceptional 4.7% |
| Scandinavians | 100.0 /100 | #15 | Exceptional 4.7% |
| Swiss | 99.9 /100 | #16 | Exceptional 4.7% |
| Filipinos | 99.9 /100 | #17 | Exceptional 4.7% |
| English | 99.9 /100 | #18 | Exceptional 4.8% |
| Europeans | 99.9 /100 | #19 | Exceptional 4.8% |
| Pennsylvania Germans | 99.9 /100 | #20 | Exceptional 4.8% |
| Immigrants | Taiwan | 99.9 /100 | #21 | Exceptional 4.8% |