Finnish vs Yuman Unemployment Among Ages 30 to 34 years
COMPARE
Finnish
Yuman
Unemployment Among Ages 30 to 34 years
Unemployment Among Ages 30 to 34 years Comparison
Finns
Yuman
5.5%
UNEMPLOYMENT AMONG AGES 30 TO 34 YEARS
30.7/ 100
METRIC RATING
195th/ 347
METRIC RANK
10.6%
UNEMPLOYMENT AMONG AGES 30 TO 34 YEARS
0.0/ 100
METRIC RATING
342nd/ 347
METRIC RANK
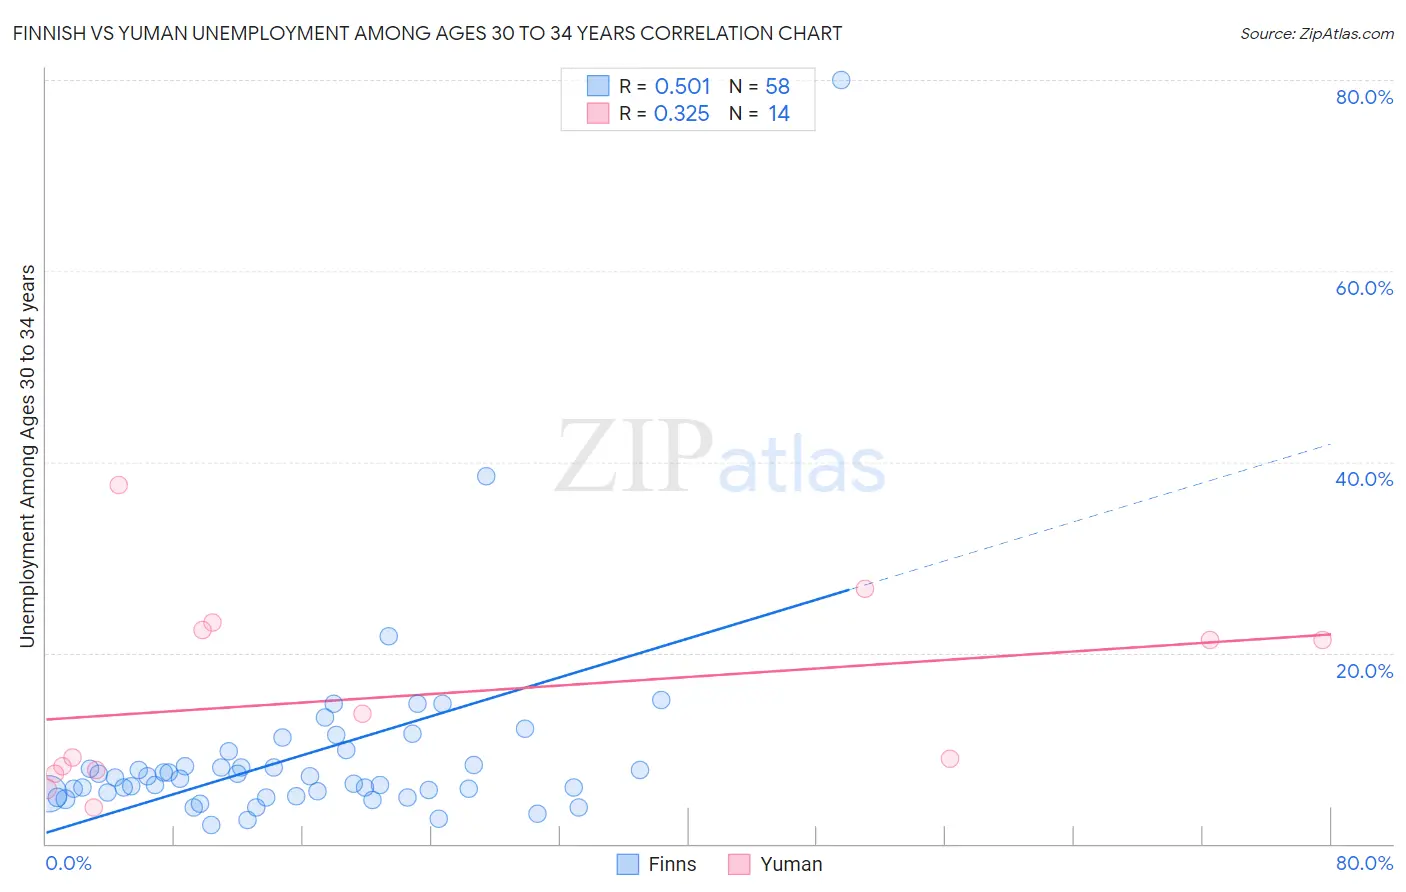
Finnish vs Yuman Unemployment Among Ages 30 to 34 years Correlation Chart
The statistical analysis conducted on geographies consisting of 373,300,326 people shows a substantial positive correlation between the proportion of Finns and unemployment rate among population between the ages 30 and 34 in the United States with a correlation coefficient (R) of 0.501 and weighted average of 5.5%. Similarly, the statistical analysis conducted on geographies consisting of 40,335,180 people shows a mild positive correlation between the proportion of Yuman and unemployment rate among population between the ages 30 and 34 in the United States with a correlation coefficient (R) of 0.325 and weighted average of 10.6%, a difference of 91.3%.
Unemployment Among Ages 30 to 34 years Correlation Summary
| Measurement | Finnish | Yuman |
| Minimum | 1.9% | 3.8% |
| Maximum | 80.0% | 37.6% |
| Range | 78.1% | 33.8% |
| Mean | 9.2% | 15.5% |
| Median | 6.9% | 11.3% |
| Interquartile 25% (IQ1) | 5.3% | 7.7% |
| Interquartile 75% (IQ3) | 8.2% | 22.4% |
| Interquartile Range (IQR) | 2.9% | 14.7% |
| Standard Deviation (Sample) | 10.9% | 10.0% |
| Standard Deviation (Population) | 10.8% | 9.6% |
Similar Demographics by Unemployment Among Ages 30 to 34 years
Demographics Similar to Finns by Unemployment Among Ages 30 to 34 years
In terms of unemployment among ages 30 to 34 years, the demographic groups most similar to Finns are Slavic (5.5%, a difference of 0.010%), Immigrants from Africa (5.5%, a difference of 0.030%), Moroccan (5.5%, a difference of 0.040%), Irish (5.5%, a difference of 0.050%), and Immigrants from South America (5.5%, a difference of 0.070%).
| Demographics | Rating | Rank | Unemployment Among Ages 30 to 34 years |
| Immigrants | Norway | 36.1 /100 | #188 | Fair 5.5% |
| Immigrants | England | 35.7 /100 | #189 | Fair 5.5% |
| Immigrants | Kazakhstan | 33.9 /100 | #190 | Fair 5.5% |
| Irish | 31.3 /100 | #191 | Fair 5.5% |
| Moroccans | 31.2 /100 | #192 | Fair 5.5% |
| Immigrants | Africa | 31.0 /100 | #193 | Fair 5.5% |
| Slavs | 30.9 /100 | #194 | Fair 5.5% |
| Finns | 30.7 /100 | #195 | Fair 5.5% |
| Immigrants | South America | 29.8 /100 | #196 | Fair 5.5% |
| Immigrants | Nicaragua | 28.9 /100 | #197 | Fair 5.5% |
| Immigrants | Afghanistan | 27.2 /100 | #198 | Fair 5.6% |
| Nicaraguans | 26.6 /100 | #199 | Fair 5.6% |
| Immigrants | Southern Europe | 25.8 /100 | #200 | Fair 5.6% |
| South American Indians | 24.4 /100 | #201 | Fair 5.6% |
| Immigrants | Germany | 22.9 /100 | #202 | Fair 5.6% |
Demographics Similar to Yuman by Unemployment Among Ages 30 to 34 years
In terms of unemployment among ages 30 to 34 years, the demographic groups most similar to Yuman are Navajo (10.6%, a difference of 0.40%), Inupiat (10.8%, a difference of 2.1%), Crow (10.3%, a difference of 2.4%), Tohono O'odham (9.8%, a difference of 7.8%), and Yakama (9.8%, a difference of 8.6%).
| Demographics | Rating | Rank | Unemployment Among Ages 30 to 34 years |
| Pueblo | 0.0 /100 | #333 | Tragic 8.3% |
| Alaska Natives | 0.0 /100 | #334 | Tragic 8.5% |
| Puerto Ricans | 0.0 /100 | #335 | Tragic 8.9% |
| Colville | 0.0 /100 | #336 | Tragic 9.0% |
| Pima | 0.0 /100 | #337 | Tragic 9.6% |
| Yakama | 0.0 /100 | #338 | Tragic 9.8% |
| Tohono O'odham | 0.0 /100 | #339 | Tragic 9.8% |
| Crow | 0.0 /100 | #340 | Tragic 10.3% |
| Navajo | 0.0 /100 | #341 | Tragic 10.6% |
| Yuman | 0.0 /100 | #342 | Tragic 10.6% |
| Inupiat | 0.0 /100 | #343 | Tragic 10.8% |
| Hopi | 0.0 /100 | #344 | Tragic 11.9% |
| Arapaho | 0.0 /100 | #345 | Tragic 12.8% |
| Tsimshian | 0.0 /100 | #346 | Tragic 13.8% |
| Yup'ik | 0.0 /100 | #347 | Tragic 18.5% |