Filipino vs Tongan Unemployment Among Ages 25 to 29 years

COMPARE

Filipino
Race
Ancestry
AfghanAfricanAlaska NativeAlaskan AthabascanAlbanianAleutAlsatianAmericanApacheArabArapahoArgentineanArmenianAssyrian/Chaldean/SyriacAustralianAustrianBahamianBangladeshiBarbadianBasqueBelgianBelizeanBermudanBhutaneseBlackfeetBolivianBrazilianBritishBritish West IndianBulgarianBurmeseCajunCambodianCanadianCape VerdeanCarpatho RusynCelticCentral AmericanCentral American IndianCherokeeCheyenneChickasawChileanChineseChippewaChoctawColombianColvilleComancheCosta RicanCreeCreekCroatianCrowCubanCypriotCzechCzechoslovakianDanishDelawareDominicanDutchDutch West IndianEastern EuropeanEcuadorianEgyptianEnglishEstonianEthiopianEuropeanFijianFilipinoFinnishFrenchFrench American IndianFrench CanadianGermanGerman RussianGhanaianGreekGuamanian/ChamorroGuatemalanGuyaneseHaitianHmongHonduranHopiHoumaHungarianIcelanderIndian (Asian)IndonesianInupiatIranianIraqiIrishIroquoisIsraeliItalianJamaicanJapaneseJordanianKenyanKiowaKoreanLaotianLatvianLebaneseLiberianLithuanianLumbeeLuxembourgerMacedonianMalaysianMalteseMarshalleseMenomineeMexicanMexican American IndianMongolianMoroccanNative HawaiianNavajoNepaleseNew ZealanderNicaraguanNigerianNorthern EuropeanNorwegianOkinawanOsageOttawaPaiutePakistaniPalestinianPanamanianParaguayanPennsylvania GermanPeruvianPimaPolishPortuguesePotawatomiPuebloPuerto RicanPuget Sound SalishRomanianRussianSalvadoranSamoanScandinavianScotch-IrishScottishSeminoleSenegaleseSerbianShoshoneSierra LeoneanSiouxSlavicSlovakSloveneSomaliSouth AfricanSouth AmericanSouth American IndianSoviet UnionSpaniardSpanishSpanish AmericanSpanish American IndianSri LankanSubsaharan AfricanSudaneseSwedishSwissSyrianTaiwaneseThaiTlingit-HaidaTohono O'OdhamTrinidadian and TobagonianTsimshianTurkishU.S. Virgin IslanderUgandanUkrainianUruguayanUteVenezuelanVietnameseWelshWest IndianYakamaYaquiYugoslavianYumanYup'ikZimbabwean
Immigration
NonimmigrantsImmigrantsAfghanistanAfricaAlbaniaArgentinaArmeniaAsiaAustraliaAustriaBahamasBangladeshBarbadosBelarusBelgiumBelizeBoliviaBosnia and HerzegovinaBrazilBulgariaBurma/MyanmarCabo VerdeCambodiaCameroonCanadaCaribbeanCentral AmericaChileChinaColombiaCongoCosta RicaCroatiaCubaCzechoslovakiaDenmarkDominicaDominican RepublicEastern AfricaEastern AsiaEastern EuropeEcuadorEgyptEl SalvadorEnglandEritreaEthiopiaEuropeFijiFranceGermanyGhanaGreeceGrenadaGuatemalaGuyanaHaitiHondurasHong KongHungaryIndiaIndonesiaIranIraqIrelandIsraelItalyJamaicaJapanJordanKazakhstanKenyaKoreaKuwaitLaosLatin AmericaLatviaLebanonLiberiaLithuaniaMalaysiaMexicoMicronesiaMiddle AfricaMoldovaMoroccoNepalNetherlandsNicaraguaNigeriaNorth AmericaNorth MacedoniaNorthern AfricaNorthern EuropeNorwayOceaniaPakistanPanamaPeruPhilippinesPolandPortugalRomaniaRussiaSaudi ArabiaScotlandSenegalSerbiaSierra LeoneSingaporeSomaliaSouth AfricaSouth AmericaSouth Central AsiaSouth Eastern AsiaSouthern EuropeSpainSri LankaSt. Vincent and the GrenadinesSudanSwedenSwitzerlandSyriaTaiwanThailandTrinidad and TobagoTurkeyUgandaUkraineUruguayUzbekistanVenezuelaVietnamWest IndiesWestern AfricaWestern AsiaWestern EuropeYemenZaireZimbabweAzores
Tongan
Race
Ancestry
AfghanAfricanAlaska NativeAlaskan AthabascanAlbanianAleutAlsatianAmericanApacheArabArapahoArgentineanArmenianAssyrian/Chaldean/SyriacAustralianAustrianBahamianBangladeshiBarbadianBasqueBelgianBelizeanBermudanBhutaneseBlackfeetBolivianBrazilianBritishBritish West IndianBulgarianBurmeseCajunCambodianCanadianCape VerdeanCarpatho RusynCelticCentral AmericanCentral American IndianCherokeeCheyenneChickasawChileanChineseChippewaChoctawColombianColvilleComancheCosta RicanCreeCreekCroatianCrowCubanCypriotCzechCzechoslovakianDanishDelawareDominicanDutchDutch West IndianEastern EuropeanEcuadorianEgyptianEnglishEstonianEthiopianEuropeanFijianFinnishFrenchFrench American IndianFrench CanadianGermanGerman RussianGhanaianGreekGuamanian/ChamorroGuatemalanGuyaneseHaitianHmongHonduranHopiHoumaHungarianIcelanderIndian (Asian)IndonesianInupiatIranianIraqiIrishIroquoisIsraeliItalianJamaicanJapaneseJordanianKenyanKiowaKoreanLaotianLatvianLebaneseLiberianLithuanianLumbeeLuxembourgerMacedonianMalaysianMalteseMarshalleseMenomineeMexicanMexican American IndianMongolianMoroccanNative HawaiianNavajoNepaleseNew ZealanderNicaraguanNigerianNorthern EuropeanNorwegianOkinawanOsageOttawaPaiutePakistaniPalestinianPanamanianParaguayanPennsylvania GermanPeruvianPimaPolishPortuguesePotawatomiPuebloPuerto RicanPuget Sound SalishRomanianRussianSalvadoranSamoanScandinavianScotch-IrishScottishSeminoleSenegaleseSerbianShoshoneSierra LeoneanSiouxSlavicSlovakSloveneSomaliSouth AfricanSouth AmericanSouth American IndianSoviet UnionSpaniardSpanishSpanish AmericanSpanish American IndianSri LankanSubsaharan AfricanSudaneseSwedishSwissSyrianTaiwaneseThaiTlingit-HaidaTohono O'OdhamTonganTrinidadian and TobagonianTsimshianTurkishU.S. Virgin IslanderUgandanUkrainianUruguayanUteVenezuelanVietnameseWelshWest IndianYakamaYaquiYugoslavianYumanYup'ikZimbabwean
Immigration
NonimmigrantsImmigrantsAfghanistanAfricaAlbaniaArgentinaArmeniaAsiaAustraliaAustriaBahamasBangladeshBarbadosBelarusBelgiumBelizeBoliviaBosnia and HerzegovinaBrazilBulgariaBurma/MyanmarCabo VerdeCambodiaCameroonCanadaCaribbeanCentral AmericaChileChinaColombiaCongoCosta RicaCroatiaCubaCzechoslovakiaDenmarkDominicaDominican RepublicEastern AfricaEastern AsiaEastern EuropeEcuadorEgyptEl SalvadorEnglandEritreaEthiopiaEuropeFijiFranceGermanyGhanaGreeceGrenadaGuatemalaGuyanaHaitiHondurasHong KongHungaryIndiaIndonesiaIranIraqIrelandIsraelItalyJamaicaJapanJordanKazakhstanKenyaKoreaKuwaitLaosLatin AmericaLatviaLebanonLiberiaLithuaniaMalaysiaMexicoMicronesiaMiddle AfricaMoldovaMoroccoNepalNetherlandsNicaraguaNigeriaNorth AmericaNorth MacedoniaNorthern AfricaNorthern EuropeNorwayOceaniaPakistanPanamaPeruPhilippinesPolandPortugalRomaniaRussiaSaudi ArabiaScotlandSenegalSerbiaSierra LeoneSingaporeSomaliaSouth AfricaSouth AmericaSouth Central AsiaSouth Eastern AsiaSouthern EuropeSpainSri LankaSt. Vincent and the GrenadinesSudanSwedenSwitzerlandSyriaTaiwanThailandTrinidad and TobagoTurkeyUgandaUkraineUruguayUzbekistanVenezuelaVietnamWest IndiesWestern AfricaWestern AsiaWestern EuropeYemenZaireZimbabweAzores
Unemployment Among Ages 25 to 29 years
Income
Poverty
Unemployment
Labor Participation
Family Structure
Vehicle Availability
Education Level
Disability

Unemployment Among Ages 25 to 29 years Comparison

Filipinos

Tongans

Exceptional
Exceptional
6.1%
UNEMPLOYMENT AMONG AGES 25 TO 29 YEARS
99.7/ 100
METRIC RATING
31st/ 347
METRIC RANK
5.5%
UNEMPLOYMENT AMONG AGES 25 TO 29 YEARS
100.0/ 100
METRIC RATING
2nd/ 347
METRIC RANK

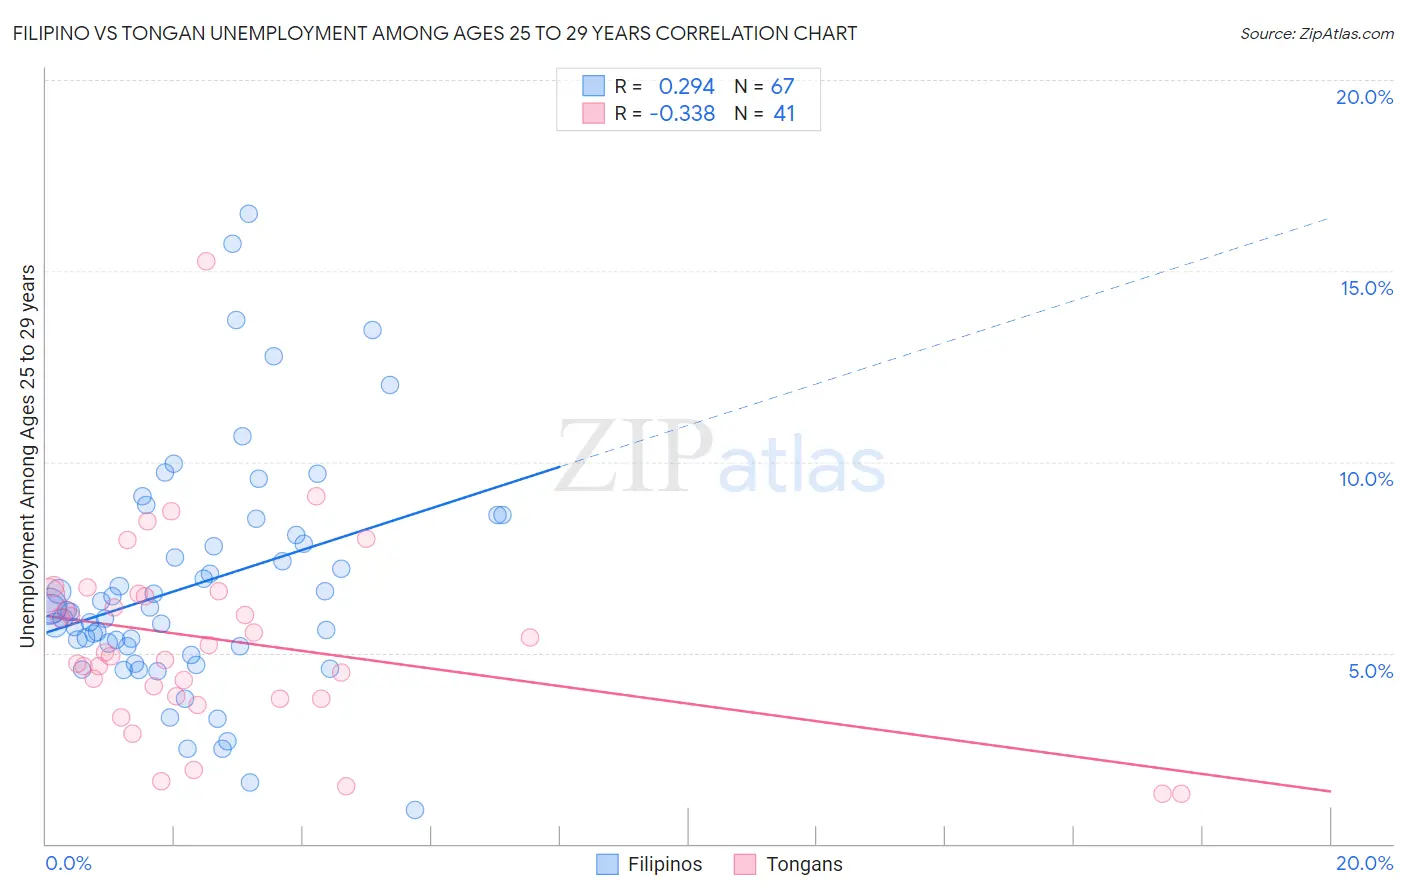
Filipino vs Tongan Unemployment Among Ages 25 to 29 years Correlation Chart

The statistical analysis conducted on geographies consisting of 247,082,146 people shows a weak positive correlation between the proportion of Filipinos and unemployment rate among population between the ages 25 and 29 in the United States with a correlation coefficient (R) of 0.294 and weighted average of 6.1%. Similarly, the statistical analysis conducted on geographies consisting of 101,173,366 people shows a mild negative correlation between the proportion of Tongans and unemployment rate among population between the ages 25 and 29 in the United States with a correlation coefficient (R) of -0.338 and weighted average of 5.5%, a difference of 10.0%.
Filipino vs Tongan Unemployment Among Ages 25 to 29 years

Unemployment Among Ages 25 to 29 years Correlation Summary

MeasurementFilipinoTongan
Minimum0.90%1.3%
Maximum16.5%15.2%
Range15.6%13.9%
Mean6.8%5.3%
Median6.1%5.0%
Interquartile 25% (IQ1)5.2%3.8%
Interquartile 75% (IQ3)8.1%6.5%
Interquartile Range (IQR)2.9%2.7%
Standard Deviation (Sample)3.1%2.5%
Standard Deviation (Population)3.0%2.5%

Similar Demographics by Unemployment Among Ages 25 to 29 years

Demographics Similar to Filipinos by Unemployment Among Ages 25 to 29 years

In terms of unemployment among ages 25 to 29 years, the demographic groups most similar to Filipinos are Bulgarian (6.1%, a difference of 0.090%), Immigrants from South Central Asia (6.1%, a difference of 0.20%), Chinese (6.1%, a difference of 0.35%), Danish (6.0%, a difference of 0.38%), and Immigrants from Zaire (6.0%, a difference of 0.43%).
DemographicsRating | RankUnemployment Among Ages 25 to 29 years
Norwegians
99.8
/100
|
#24
Exceptional
6.0%
New Zealanders
99.8
/100
|
#25
Exceptional
6.0%
Immigrants | Eastern Africa
99.8
/100
|
#26
Exceptional
6.0%
Immigrants | Zaire
99.7
/100
|
#27
Exceptional
6.0%
Danes
99.7
/100
|
#28
Exceptional
6.0%
Immigrants | South Central Asia
99.7
/100
|
#29
Exceptional
6.1%
Bulgarians
99.7
/100
|
#30
Exceptional
6.1%
Filipinos
99.7
/100
|
#31
Exceptional
6.1%
Chinese
99.6
/100
|
#32
Exceptional
6.1%
Yugoslavians
99.6
/100
|
#33
Exceptional
6.1%
Immigrants | Morocco
99.5
/100
|
#34
Exceptional
6.1%
Immigrants | Zimbabwe
99.5
/100
|
#35
Exceptional
6.1%
Taiwanese
99.5
/100
|
#36
Exceptional
6.1%
Immigrants | Serbia
99.5
/100
|
#37
Exceptional
6.1%
Ethiopians
99.4
/100
|
#38
Exceptional
6.1%

Demographics Similar to Tongans by Unemployment Among Ages 25 to 29 years

In terms of unemployment among ages 25 to 29 years, the demographic groups most similar to Tongans are Immigrants from Somalia (5.5%, a difference of 0.31%), Immigrants from Cuba (5.6%, a difference of 2.4%), Somali (5.6%, a difference of 2.4%), Sudanese (5.4%, a difference of 2.5%), and Hmong (5.7%, a difference of 2.6%).
DemographicsRating | RankUnemployment Among Ages 25 to 29 years
Sudanese
100.0
/100
|
#1
Exceptional
5.4%
Tongans
100.0
/100
|
#2
Exceptional
5.5%
Immigrants | Somalia
100.0
/100
|
#3
Exceptional
5.5%
Immigrants | Cuba
100.0
/100
|
#4
Exceptional
5.6%
Somalis
100.0
/100
|
#5
Exceptional
5.6%
Hmong
100.0
/100
|
#6
Exceptional
5.7%
Immigrants | India
100.0
/100
|
#7
Exceptional
5.7%
Immigrants | Bosnia and Herzegovina
100.0
/100
|
#8
Exceptional
5.7%
Immigrants | Nepal
100.0
/100
|
#9
Exceptional
5.7%
Immigrants | Sudan
100.0
/100
|
#10
Exceptional
5.8%
Cambodians
100.0
/100
|
#11
Exceptional
5.8%
Okinawans
100.0
/100
|
#12
Exceptional
5.9%
Immigrants | Bolivia
100.0
/100
|
#13
Exceptional
5.9%
Immigrants | Kuwait
99.9
/100
|
#14
Exceptional
5.9%
Cubans
99.9
/100
|
#15
Exceptional
5.9%