Filipino vs American Unemployment Among Youth under 25 years

COMPARE

Filipino
Race
Ancestry
AfghanAfricanAlaska NativeAlaskan AthabascanAlbanianAleutAlsatianApacheArabArapahoArgentineanArmenianAssyrian/Chaldean/SyriacAustralianAustrianBahamianBangladeshiBarbadianBasqueBelgianBelizeanBermudanBhutaneseBlackfeetBolivianBrazilianBritishBritish West IndianBulgarianBurmeseCajunCambodianCanadianCape VerdeanCarpatho RusynCelticCentral AmericanCentral American IndianCherokeeCheyenneChickasawChileanChineseChippewaChoctawColombianColvilleComancheCosta RicanCreeCreekCroatianCrowCubanCypriotCzechCzechoslovakianDanishDelawareDominicanDutchDutch West IndianEastern EuropeanEcuadorianEgyptianEnglishEstonianEthiopianEuropeanFijianFilipinoFinnishFrenchFrench American IndianFrench CanadianGermanGerman RussianGhanaianGreekGuamanian/ChamorroGuatemalanGuyaneseHaitianHmongHonduranHopiHoumaHungarianIcelanderIndian (Asian)IndonesianInupiatIranianIraqiIrishIroquoisIsraeliItalianJamaicanJapaneseJordanianKenyanKiowaKoreanLaotianLatvianLebaneseLiberianLithuanianLumbeeLuxembourgerMacedonianMalaysianMalteseMarshalleseMenomineeMexicanMexican American IndianMongolianMoroccanNative HawaiianNavajoNepaleseNew ZealanderNicaraguanNigerianNorthern EuropeanNorwegianOkinawanOsageOttawaPaiutePakistaniPalestinianPanamanianParaguayanPennsylvania GermanPeruvianPimaPolishPortuguesePotawatomiPuebloPuerto RicanPuget Sound SalishRomanianRussianSalvadoranSamoanScandinavianScotch-IrishScottishSeminoleSenegaleseSerbianShoshoneSierra LeoneanSiouxSlavicSlovakSloveneSomaliSouth AfricanSouth AmericanSouth American IndianSoviet UnionSpaniardSpanishSpanish AmericanSpanish American IndianSri LankanSubsaharan AfricanSudaneseSwedishSwissSyrianTaiwaneseThaiTlingit-HaidaTohono O'OdhamTonganTrinidadian and TobagonianTsimshianTurkishU.S. Virgin IslanderUgandanUkrainianUruguayanUteVenezuelanVietnameseWelshWest IndianYakamaYaquiYugoslavianYumanYup'ikZimbabwean
Immigration
NonimmigrantsImmigrantsAfghanistanAfricaAlbaniaArgentinaArmeniaAsiaAustraliaAustriaBahamasBangladeshBarbadosBelarusBelgiumBelizeBoliviaBosnia and HerzegovinaBrazilBulgariaBurma/MyanmarCabo VerdeCambodiaCameroonCanadaCaribbeanCentral AmericaChileChinaColombiaCongoCosta RicaCroatiaCubaCzechoslovakiaDenmarkDominicaDominican RepublicEastern AfricaEastern AsiaEastern EuropeEcuadorEgyptEl SalvadorEnglandEritreaEthiopiaEuropeFijiFranceGermanyGhanaGreeceGrenadaGuatemalaGuyanaHaitiHondurasHong KongHungaryIndiaIndonesiaIranIraqIrelandIsraelItalyJamaicaJapanJordanKazakhstanKenyaKoreaKuwaitLaosLatin AmericaLatviaLebanonLiberiaLithuaniaMalaysiaMexicoMicronesiaMiddle AfricaMoldovaMoroccoNepalNetherlandsNicaraguaNigeriaNorth AmericaNorth MacedoniaNorthern AfricaNorthern EuropeNorwayOceaniaPakistanPanamaPeruPhilippinesPolandPortugalRomaniaRussiaSaudi ArabiaScotlandSenegalSerbiaSierra LeoneSingaporeSomaliaSouth AfricaSouth AmericaSouth Central AsiaSouth Eastern AsiaSouthern EuropeSpainSri LankaSt. Vincent and the GrenadinesSudanSwedenSwitzerlandSyriaTaiwanThailandTrinidad and TobagoTurkeyUgandaUkraineUruguayUzbekistanVenezuelaVietnamWest IndiesWestern AfricaWestern AsiaWestern EuropeYemenZaireZimbabweAzores
American
Race
Ancestry
AfghanAfricanAlaska NativeAlaskan AthabascanAlbanianAleutAlsatianAmericanApacheArabArapahoArgentineanArmenianAssyrian/Chaldean/SyriacAustralianAustrianBahamianBangladeshiBarbadianBasqueBelgianBelizeanBermudanBhutaneseBlackfeetBolivianBrazilianBritishBritish West IndianBulgarianBurmeseCajunCambodianCanadianCape VerdeanCarpatho RusynCelticCentral AmericanCentral American IndianCherokeeCheyenneChickasawChileanChineseChippewaChoctawColombianColvilleComancheCosta RicanCreeCreekCroatianCrowCubanCypriotCzechCzechoslovakianDanishDelawareDominicanDutchDutch West IndianEastern EuropeanEcuadorianEgyptianEnglishEstonianEthiopianEuropeanFijianFinnishFrenchFrench American IndianFrench CanadianGermanGerman RussianGhanaianGreekGuamanian/ChamorroGuatemalanGuyaneseHaitianHmongHonduranHopiHoumaHungarianIcelanderIndian (Asian)IndonesianInupiatIranianIraqiIrishIroquoisIsraeliItalianJamaicanJapaneseJordanianKenyanKiowaKoreanLaotianLatvianLebaneseLiberianLithuanianLumbeeLuxembourgerMacedonianMalaysianMalteseMarshalleseMenomineeMexicanMexican American IndianMongolianMoroccanNative HawaiianNavajoNepaleseNew ZealanderNicaraguanNigerianNorthern EuropeanNorwegianOkinawanOsageOttawaPaiutePakistaniPalestinianPanamanianParaguayanPennsylvania GermanPeruvianPimaPolishPortuguesePotawatomiPuebloPuerto RicanPuget Sound SalishRomanianRussianSalvadoranSamoanScandinavianScotch-IrishScottishSeminoleSenegaleseSerbianShoshoneSierra LeoneanSiouxSlavicSlovakSloveneSomaliSouth AfricanSouth AmericanSouth American IndianSoviet UnionSpaniardSpanishSpanish AmericanSpanish American IndianSri LankanSubsaharan AfricanSudaneseSwedishSwissSyrianTaiwaneseThaiTlingit-HaidaTohono O'OdhamTonganTrinidadian and TobagonianTsimshianTurkishU.S. Virgin IslanderUgandanUkrainianUruguayanUteVenezuelanVietnameseWelshWest IndianYakamaYaquiYugoslavianYumanYup'ikZimbabwean
Immigration
NonimmigrantsImmigrantsAfghanistanAfricaAlbaniaArgentinaArmeniaAsiaAustraliaAustriaBahamasBangladeshBarbadosBelarusBelgiumBelizeBoliviaBosnia and HerzegovinaBrazilBulgariaBurma/MyanmarCabo VerdeCambodiaCameroonCanadaCaribbeanCentral AmericaChileChinaColombiaCongoCosta RicaCroatiaCubaCzechoslovakiaDenmarkDominicaDominican RepublicEastern AfricaEastern AsiaEastern EuropeEcuadorEgyptEl SalvadorEnglandEritreaEthiopiaEuropeFijiFranceGermanyGhanaGreeceGrenadaGuatemalaGuyanaHaitiHondurasHong KongHungaryIndiaIndonesiaIranIraqIrelandIsraelItalyJamaicaJapanJordanKazakhstanKenyaKoreaKuwaitLaosLatin AmericaLatviaLebanonLiberiaLithuaniaMalaysiaMexicoMicronesiaMiddle AfricaMoldovaMoroccoNepalNetherlandsNicaraguaNigeriaNorth AmericaNorth MacedoniaNorthern AfricaNorthern EuropeNorwayOceaniaPakistanPanamaPeruPhilippinesPolandPortugalRomaniaRussiaSaudi ArabiaScotlandSenegalSerbiaSierra LeoneSingaporeSomaliaSouth AfricaSouth AmericaSouth Central AsiaSouth Eastern AsiaSouthern EuropeSpainSri LankaSt. Vincent and the GrenadinesSudanSwedenSwitzerlandSyriaTaiwanThailandTrinidad and TobagoTurkeyUgandaUkraineUruguayUzbekistanVenezuelaVietnamWest IndiesWestern AfricaWestern AsiaWestern EuropeYemenZaireZimbabweAzores
Unemployment Among Youth under 25 years
Income
Poverty
Unemployment
Labor Participation
Family Structure
Vehicle Availability
Education Level
Disability

Unemployment Among Youth under 25 years Comparison

Filipinos

Americans

Exceptional
Fair
11.1%
UNEMPLOYMENT AMONG YOUTH UNDER 25 YEARS
98.3/ 100
METRIC RATING
61st/ 347
METRIC RANK
11.7%
UNEMPLOYMENT AMONG YOUTH UNDER 25 YEARS
34.5/ 100
METRIC RATING
183rd/ 347
METRIC RANK

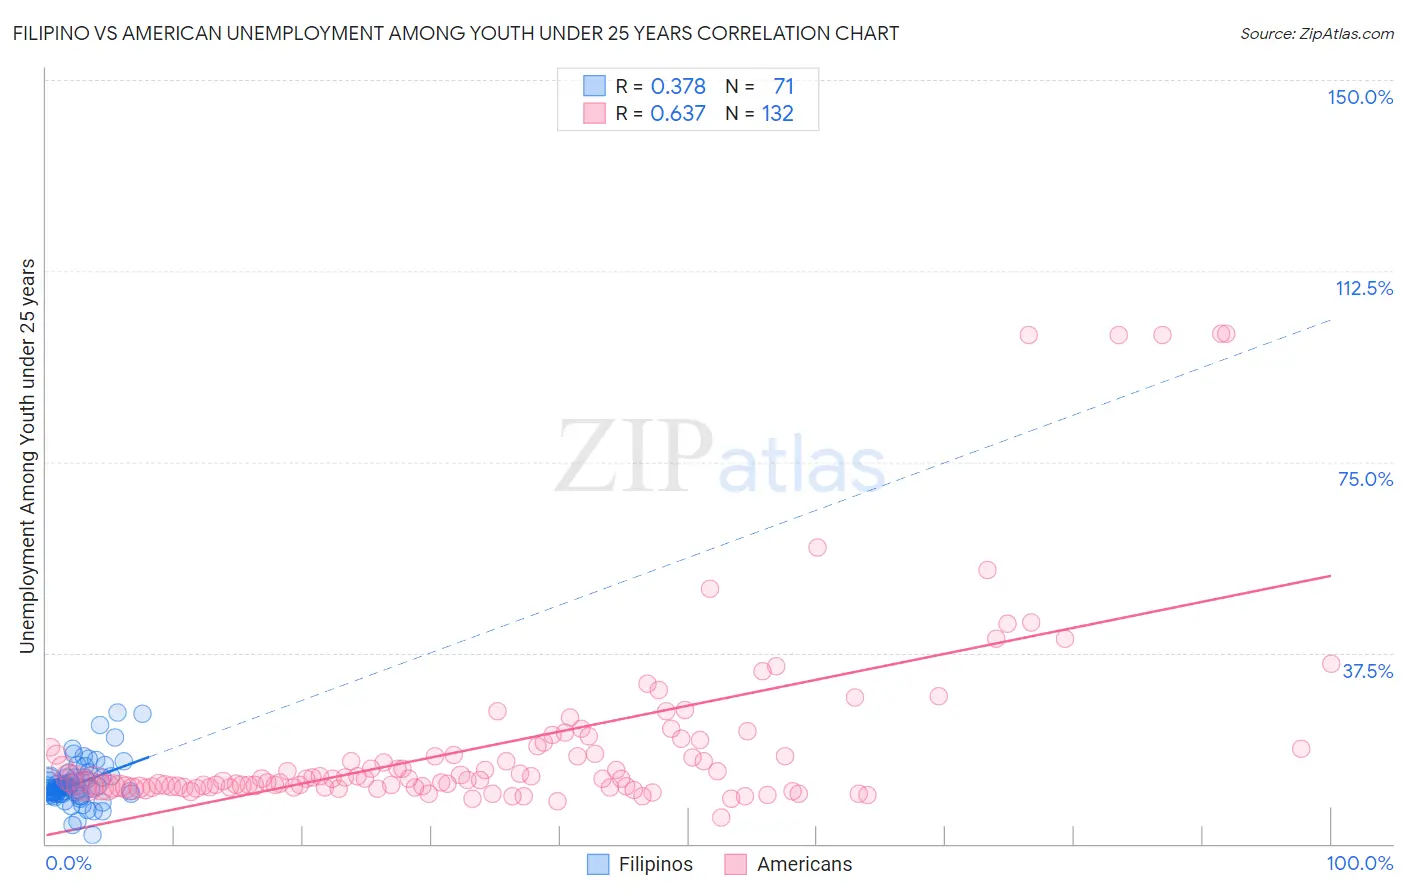
Filipino vs American Unemployment Among Youth under 25 years Correlation Chart

The statistical analysis conducted on geographies consisting of 253,048,092 people shows a mild positive correlation between the proportion of Filipinos and unemployment rate among youth under the age of 25 in the United States with a correlation coefficient (R) of 0.378 and weighted average of 11.1%. Similarly, the statistical analysis conducted on geographies consisting of 554,335,703 people shows a significant positive correlation between the proportion of Americans and unemployment rate among youth under the age of 25 in the United States with a correlation coefficient (R) of 0.637 and weighted average of 11.7%, a difference of 5.0%.
Filipino vs American Unemployment Among Youth under 25 years

Unemployment Among Youth under 25 years Correlation Summary

MeasurementFilipinoAmerican
Minimum1.7%5.1%
Maximum25.9%100.1%
Range24.2%95.0%
Mean11.8%19.6%
Median11.0%12.8%
Interquartile 25% (IQ1)9.8%11.1%
Interquartile 75% (IQ3)13.1%19.1%
Interquartile Range (IQR)3.4%8.0%
Standard Deviation (Sample)4.3%18.5%
Standard Deviation (Population)4.3%18.5%

Similar Demographics by Unemployment Among Youth under 25 years

Demographics Similar to Filipinos by Unemployment Among Youth under 25 years

In terms of unemployment among youth under 25 years, the demographic groups most similar to Filipinos are Immigrants from Netherlands (11.1%, a difference of 0.090%), Immigrants from Croatia (11.1%, a difference of 0.10%), South African (11.1%, a difference of 0.18%), Jordanian (11.1%, a difference of 0.22%), and Immigrants from Singapore (11.2%, a difference of 0.28%).
DemographicsRating | RankUnemployment Among Youth under 25 years
Mongolians
98.9
/100
|
#54
Exceptional
11.1%
Irish
98.9
/100
|
#55
Exceptional
11.1%
Immigrants | Saudi Arabia
98.8
/100
|
#56
Exceptional
11.1%
Immigrants | Eritrea
98.8
/100
|
#57
Exceptional
11.1%
Scotch-Irish
98.8
/100
|
#58
Exceptional
11.1%
Immigrants | Eastern Africa
98.7
/100
|
#59
Exceptional
11.1%
South Africans
98.5
/100
|
#60
Exceptional
11.1%
Filipinos
98.3
/100
|
#61
Exceptional
11.1%
Immigrants | Netherlands
98.1
/100
|
#62
Exceptional
11.1%
Immigrants | Croatia
98.1
/100
|
#63
Exceptional
11.1%
Jordanians
97.9
/100
|
#64
Exceptional
11.1%
Immigrants | Singapore
97.8
/100
|
#65
Exceptional
11.2%
Macedonians
97.7
/100
|
#66
Exceptional
11.2%
Chickasaw
97.7
/100
|
#67
Exceptional
11.2%
Immigrants | Kenya
97.6
/100
|
#68
Exceptional
11.2%

Demographics Similar to Americans by Unemployment Among Youth under 25 years

In terms of unemployment among youth under 25 years, the demographic groups most similar to Americans are Immigrants from Eastern Europe (11.7%, a difference of 0.010%), French American Indian (11.7%, a difference of 0.020%), Maltese (11.7%, a difference of 0.030%), Immigrants from Italy (11.7%, a difference of 0.080%), and Immigrants from Egypt (11.7%, a difference of 0.12%).
DemographicsRating | RankUnemployment Among Youth under 25 years
Ugandans
45.6
/100
|
#176
Average
11.6%
Immigrants | Denmark
45.0
/100
|
#177
Average
11.6%
Immigrants | Europe
42.4
/100
|
#178
Average
11.6%
Immigrants | Hong Kong
42.4
/100
|
#179
Average
11.6%
Spaniards
39.8
/100
|
#180
Fair
11.7%
Syrians
38.4
/100
|
#181
Fair
11.7%
Immigrants | Italy
36.2
/100
|
#182
Fair
11.7%
Americans
34.5
/100
|
#183
Fair
11.7%
Immigrants | Eastern Europe
34.1
/100
|
#184
Fair
11.7%
French American Indians
34.0
/100
|
#185
Fair
11.7%
Maltese
33.9
/100
|
#186
Fair
11.7%
Immigrants | Egypt
31.9
/100
|
#187
Fair
11.7%
Immigrants | Poland
31.4
/100
|
#188
Fair
11.7%
Japanese
30.8
/100
|
#189
Fair
11.7%
Portuguese
30.3
/100
|
#190
Fair
11.7%