Fijian vs Tohono O'odham Unemployment Among Women with Children Under 18 years
COMPARE
Fijian
Tohono O'odham
Unemployment Among Women with Children Under 18 years
Unemployment Among Women with Children Under 18 years Comparison
Fijians
Tohono O'odham
5.1%
UNEMPLOYMENT AMONG WOMEN WITH CHILDREN UNDER 18 YEARS
96.9/ 100
METRIC RATING
67th/ 347
METRIC RANK
8.9%
UNEMPLOYMENT AMONG WOMEN WITH CHILDREN UNDER 18 YEARS
0.0/ 100
METRIC RATING
341st/ 347
METRIC RANK
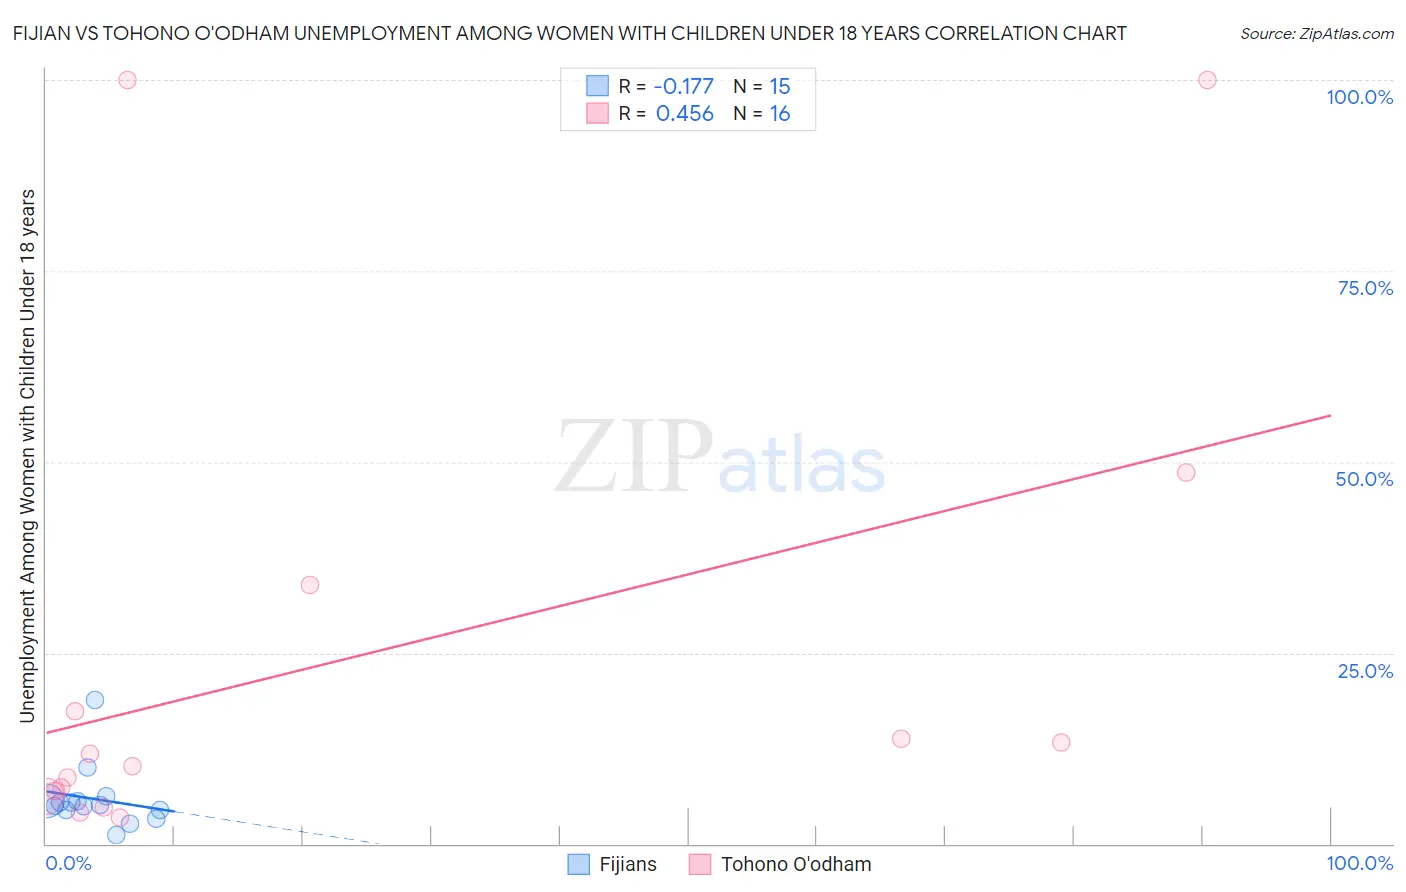
Fijian vs Tohono O'odham Unemployment Among Women with Children Under 18 years Correlation Chart
The statistical analysis conducted on geographies consisting of 55,417,162 people shows a poor negative correlation between the proportion of Fijians and unemployment rate among women with children under the age of 18 in the United States with a correlation coefficient (R) of -0.177 and weighted average of 5.1%. Similarly, the statistical analysis conducted on geographies consisting of 58,389,482 people shows a moderate positive correlation between the proportion of Tohono O'odham and unemployment rate among women with children under the age of 18 in the United States with a correlation coefficient (R) of 0.456 and weighted average of 8.9%, a difference of 73.3%.
Unemployment Among Women with Children Under 18 years Correlation Summary
| Measurement | Fijian | Tohono O'odham |
| Minimum | 1.2% | 3.4% |
| Maximum | 18.8% | 100.0% |
| Range | 17.6% | 96.6% |
| Mean | 5.9% | 24.4% |
| Median | 5.0% | 10.9% |
| Interquartile 25% (IQ1) | 4.4% | 6.5% |
| Interquartile 75% (IQ3) | 5.6% | 25.6% |
| Interquartile Range (IQR) | 1.2% | 19.1% |
| Standard Deviation (Sample) | 4.1% | 31.8% |
| Standard Deviation (Population) | 3.9% | 30.8% |
Similar Demographics by Unemployment Among Women with Children Under 18 years
Demographics Similar to Fijians by Unemployment Among Women with Children Under 18 years
In terms of unemployment among women with children under 18 years, the demographic groups most similar to Fijians are Immigrants from Australia (5.1%, a difference of 0.020%), Irish (5.1%, a difference of 0.090%), Immigrants from Sweden (5.1%, a difference of 0.12%), Estonian (5.1%, a difference of 0.14%), and Austrian (5.1%, a difference of 0.23%).
| Demographics | Rating | Rank | Unemployment Among Women with Children Under 18 years |
| Welsh | 97.7 /100 | #60 | Exceptional 5.1% |
| Russians | 97.5 /100 | #61 | Exceptional 5.1% |
| Immigrants | Bulgaria | 97.4 /100 | #62 | Exceptional 5.1% |
| Italians | 97.4 /100 | #63 | Exceptional 5.1% |
| Estonians | 97.2 /100 | #64 | Exceptional 5.1% |
| Immigrants | Sweden | 97.1 /100 | #65 | Exceptional 5.1% |
| Immigrants | Australia | 97.0 /100 | #66 | Exceptional 5.1% |
| Fijians | 96.9 /100 | #67 | Exceptional 5.1% |
| Irish | 96.8 /100 | #68 | Exceptional 5.1% |
| Austrians | 96.6 /100 | #69 | Exceptional 5.1% |
| Icelanders | 96.6 /100 | #70 | Exceptional 5.1% |
| Serbians | 96.5 /100 | #71 | Exceptional 5.1% |
| Immigrants | Bolivia | 96.1 /100 | #72 | Exceptional 5.1% |
| Albanians | 95.9 /100 | #73 | Exceptional 5.1% |
| Immigrants | Northern Europe | 95.9 /100 | #74 | Exceptional 5.1% |
Demographics Similar to Tohono O'odham by Unemployment Among Women with Children Under 18 years
In terms of unemployment among women with children under 18 years, the demographic groups most similar to Tohono O'odham are Puerto Rican (9.0%, a difference of 1.7%), Arapaho (9.2%, a difference of 3.8%), Crow (8.2%, a difference of 7.5%), Navajo (8.2%, a difference of 7.7%), and Inupiat (9.6%, a difference of 8.1%).
| Demographics | Rating | Rank | Unemployment Among Women with Children Under 18 years |
| Immigrants | Dominican Republic | 0.0 /100 | #333 | Tragic 7.5% |
| Cheyenne | 0.0 /100 | #334 | Tragic 7.8% |
| Apache | 0.0 /100 | #335 | Tragic 7.9% |
| Sioux | 0.0 /100 | #336 | Tragic 7.9% |
| Yakama | 0.0 /100 | #337 | Tragic 8.1% |
| Immigrants | Yemen | 0.0 /100 | #338 | Tragic 8.2% |
| Navajo | 0.0 /100 | #339 | Tragic 8.2% |
| Crow | 0.0 /100 | #340 | Tragic 8.2% |
| Tohono O'odham | 0.0 /100 | #341 | Tragic 8.9% |
| Puerto Ricans | 0.0 /100 | #342 | Tragic 9.0% |
| Arapaho | 0.0 /100 | #343 | Tragic 9.2% |
| Inupiat | 0.0 /100 | #344 | Tragic 9.6% |
| Yuman | 0.0 /100 | #345 | Tragic 9.8% |
| Yup'ik | 0.0 /100 | #346 | Tragic 11.0% |
| Pima | 0.0 /100 | #347 | Tragic 11.7% |