European vs Immigrants from Sweden Unemployment Among Seniors over 65 years

COMPARE

European
Race
Ancestry
AfghanAfricanAlaska NativeAlaskan AthabascanAlbanianAleutAlsatianAmericanApacheArabArapahoArgentineanArmenianAssyrian/Chaldean/SyriacAustralianAustrianBahamianBangladeshiBarbadianBasqueBelgianBelizeanBermudanBhutaneseBlackfeetBolivianBrazilianBritishBritish West IndianBulgarianBurmeseCajunCambodianCanadianCape VerdeanCarpatho RusynCelticCentral AmericanCentral American IndianCherokeeCheyenneChickasawChileanChineseChippewaChoctawColombianColvilleComancheCosta RicanCreeCreekCroatianCrowCubanCypriotCzechCzechoslovakianDanishDelawareDominicanDutchDutch West IndianEastern EuropeanEcuadorianEgyptianEnglishEstonianEthiopianEuropeanFijianFilipinoFinnishFrenchFrench American IndianFrench CanadianGermanGerman RussianGhanaianGreekGuamanian/ChamorroGuatemalanGuyaneseHaitianHmongHonduranHopiHoumaHungarianIcelanderIndian (Asian)IndonesianInupiatIranianIraqiIrishIroquoisIsraeliItalianJamaicanJapaneseJordanianKenyanKiowaKoreanLaotianLatvianLebaneseLiberianLithuanianLumbeeLuxembourgerMacedonianMalaysianMalteseMarshalleseMenomineeMexicanMexican American IndianMongolianMoroccanNative HawaiianNavajoNepaleseNew ZealanderNicaraguanNigerianNorthern EuropeanNorwegianOkinawanOsageOttawaPaiutePakistaniPalestinianPanamanianParaguayanPennsylvania GermanPeruvianPimaPolishPortuguesePotawatomiPuebloPuerto RicanPuget Sound SalishRomanianRussianSalvadoranSamoanScandinavianScotch-IrishScottishSeminoleSenegaleseSerbianShoshoneSierra LeoneanSiouxSlavicSlovakSloveneSomaliSouth AfricanSouth AmericanSouth American IndianSoviet UnionSpaniardSpanishSpanish AmericanSpanish American IndianSri LankanSubsaharan AfricanSudaneseSwedishSwissSyrianTaiwaneseThaiTlingit-HaidaTohono O'OdhamTonganTrinidadian and TobagonianTsimshianTurkishU.S. Virgin IslanderUgandanUkrainianUruguayanUteVenezuelanVietnameseWelshWest IndianYakamaYaquiYugoslavianYumanYup'ikZimbabwean
Immigration
NonimmigrantsImmigrantsAfghanistanAfricaAlbaniaArgentinaArmeniaAsiaAustraliaAustriaBahamasBangladeshBarbadosBelarusBelgiumBelizeBoliviaBosnia and HerzegovinaBrazilBulgariaBurma/MyanmarCabo VerdeCambodiaCameroonCanadaCaribbeanCentral AmericaChileChinaColombiaCongoCosta RicaCroatiaCubaCzechoslovakiaDenmarkDominicaDominican RepublicEastern AfricaEastern AsiaEastern EuropeEcuadorEgyptEl SalvadorEnglandEritreaEthiopiaEuropeFijiFranceGermanyGhanaGreeceGrenadaGuatemalaGuyanaHaitiHondurasHong KongHungaryIndiaIndonesiaIranIraqIrelandIsraelItalyJamaicaJapanJordanKazakhstanKenyaKoreaKuwaitLaosLatin AmericaLatviaLebanonLiberiaLithuaniaMalaysiaMexicoMicronesiaMiddle AfricaMoldovaMoroccoNepalNetherlandsNicaraguaNigeriaNorth AmericaNorth MacedoniaNorthern AfricaNorthern EuropeNorwayOceaniaPakistanPanamaPeruPhilippinesPolandPortugalRomaniaRussiaSaudi ArabiaScotlandSenegalSerbiaSierra LeoneSingaporeSomaliaSouth AfricaSouth AmericaSouth Central AsiaSouth Eastern AsiaSouthern EuropeSpainSri LankaSt. Vincent and the GrenadinesSudanSwitzerlandSyriaTaiwanThailandTrinidad and TobagoTurkeyUgandaUkraineUruguayUzbekistanVenezuelaVietnamWest IndiesWestern AfricaWestern AsiaWestern EuropeYemenZaireZimbabweAzores
Immigrants from Sweden
Race
Ancestry
AfghanAfricanAlaska NativeAlaskan AthabascanAlbanianAleutAlsatianAmericanApacheArabArapahoArgentineanArmenianAssyrian/Chaldean/SyriacAustralianAustrianBahamianBangladeshiBarbadianBasqueBelgianBelizeanBermudanBhutaneseBlackfeetBolivianBrazilianBritishBritish West IndianBulgarianBurmeseCajunCambodianCanadianCape VerdeanCarpatho RusynCelticCentral AmericanCentral American IndianCherokeeCheyenneChickasawChileanChineseChippewaChoctawColombianColvilleComancheCosta RicanCreeCreekCroatianCrowCubanCypriotCzechCzechoslovakianDanishDelawareDominicanDutchDutch West IndianEastern EuropeanEcuadorianEgyptianEnglishEstonianEthiopianFijianFilipinoFinnishFrenchFrench American IndianFrench CanadianGermanGerman RussianGhanaianGreekGuamanian/ChamorroGuatemalanGuyaneseHaitianHmongHonduranHopiHoumaHungarianIcelanderIndian (Asian)IndonesianInupiatIranianIraqiIrishIroquoisIsraeliItalianJamaicanJapaneseJordanianKenyanKiowaKoreanLaotianLatvianLebaneseLiberianLithuanianLumbeeLuxembourgerMacedonianMalaysianMalteseMarshalleseMenomineeMexicanMexican American IndianMongolianMoroccanNative HawaiianNavajoNepaleseNew ZealanderNicaraguanNigerianNorthern EuropeanNorwegianOkinawanOsageOttawaPaiutePakistaniPalestinianPanamanianParaguayanPennsylvania GermanPeruvianPimaPolishPortuguesePotawatomiPuebloPuerto RicanPuget Sound SalishRomanianRussianSalvadoranSamoanScandinavianScotch-IrishScottishSeminoleSenegaleseSerbianShoshoneSierra LeoneanSiouxSlavicSlovakSloveneSomaliSouth AfricanSouth AmericanSouth American IndianSoviet UnionSpaniardSpanishSpanish AmericanSpanish American IndianSri LankanSubsaharan AfricanSudaneseSwedishSwissSyrianTaiwaneseThaiTlingit-HaidaTohono O'OdhamTonganTrinidadian and TobagonianTsimshianTurkishU.S. Virgin IslanderUgandanUkrainianUruguayanUteVenezuelanVietnameseWelshWest IndianYakamaYaquiYugoslavianYumanYup'ikZimbabwean
Immigration
NonimmigrantsImmigrantsAfghanistanAfricaAlbaniaArgentinaArmeniaAsiaAustraliaAustriaBahamasBangladeshBarbadosBelarusBelgiumBelizeBoliviaBosnia and HerzegovinaBrazilBulgariaBurma/MyanmarCabo VerdeCambodiaCameroonCanadaCaribbeanCentral AmericaChileChinaColombiaCongoCosta RicaCroatiaCubaCzechoslovakiaDenmarkDominicaDominican RepublicEastern AfricaEastern AsiaEastern EuropeEcuadorEgyptEl SalvadorEnglandEritreaEthiopiaEuropeFijiFranceGermanyGhanaGreeceGrenadaGuatemalaGuyanaHaitiHondurasHong KongHungaryIndiaIndonesiaIranIraqIrelandIsraelItalyJamaicaJapanJordanKazakhstanKenyaKoreaKuwaitLaosLatin AmericaLatviaLebanonLiberiaLithuaniaMalaysiaMexicoMicronesiaMiddle AfricaMoldovaMoroccoNepalNetherlandsNicaraguaNigeriaNorth AmericaNorth MacedoniaNorthern AfricaNorthern EuropeNorwayOceaniaPakistanPanamaPeruPhilippinesPolandPortugalRomaniaRussiaSaudi ArabiaScotlandSenegalSerbiaSierra LeoneSingaporeSomaliaSouth AfricaSouth AmericaSouth Central AsiaSouth Eastern AsiaSouthern EuropeSpainSri LankaSt. Vincent and the GrenadinesSudanSwedenSwitzerlandSyriaTaiwanThailandTrinidad and TobagoTurkeyUgandaUkraineUruguayUzbekistanVenezuelaVietnamWest IndiesWestern AfricaWestern AsiaWestern EuropeYemenZaireZimbabweAzores
Unemployment Among Seniors over 65 years
Income
Poverty
Unemployment
Labor Participation
Family Structure
Vehicle Availability
Education Level
Disability

Unemployment Among Seniors over 65 years Comparison

Europeans

Immigrants from Sweden

Exceptional
Exceptional
4.9%
UNEMPLOYMENT AMONG SENIORS OVER 65 YEARS
99.8/ 100
METRIC RATING
55th/ 347
METRIC RANK
4.8%
UNEMPLOYMENT AMONG SENIORS OVER 65 YEARS
99.9/ 100
METRIC RATING
40th/ 347
METRIC RANK

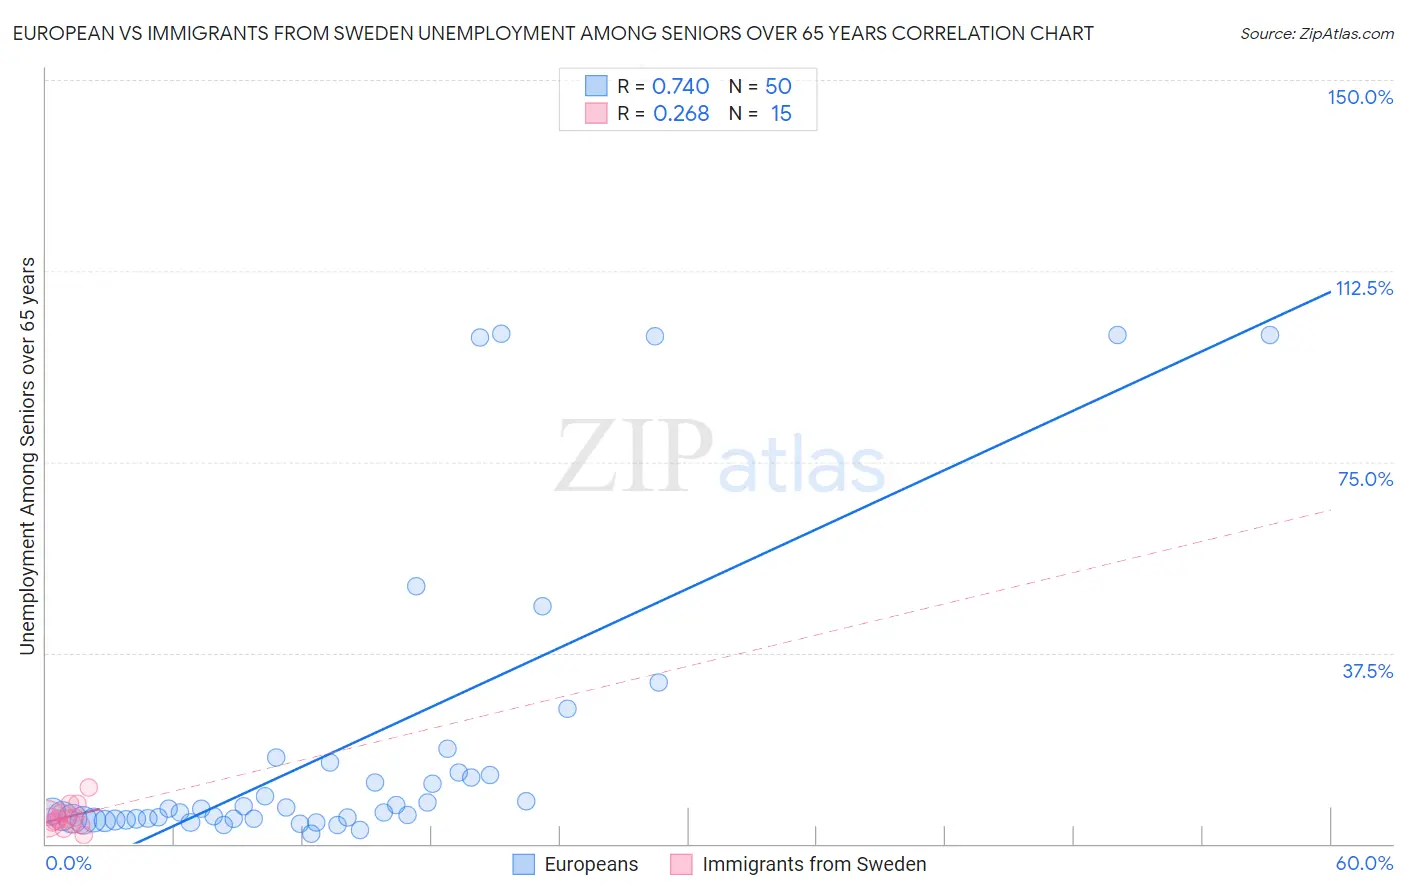
European vs Immigrants from Sweden Unemployment Among Seniors over 65 years Correlation Chart

The statistical analysis conducted on geographies consisting of 457,694,683 people shows a strong positive correlation between the proportion of Europeans and unemployment rate amomg seniors over the age of 65 in the United States with a correlation coefficient (R) of 0.740 and weighted average of 4.9%. Similarly, the statistical analysis conducted on geographies consisting of 157,042,986 people shows a weak positive correlation between the proportion of Immigrants from Sweden and unemployment rate amomg seniors over the age of 65 in the United States with a correlation coefficient (R) of 0.268 and weighted average of 4.8%, a difference of 0.82%.
European vs Immigrants from Sweden Unemployment Among Seniors over 65 years

Unemployment Among Seniors over 65 years Correlation Summary

MeasurementEuropeanImmigrants from Sweden
Minimum2.0%1.6%
Maximum100.1%11.1%
Range98.1%9.5%
Mean19.0%5.2%
Median6.6%4.8%
Interquartile 25% (IQ1)4.9%4.0%
Interquartile 75% (IQ3)14.0%6.0%
Interquartile Range (IQR)9.1%2.0%
Standard Deviation (Sample)28.9%2.3%
Standard Deviation (Population)28.6%2.2%

Demographics Similar to Europeans and Immigrants from Sweden by Unemployment Among Seniors over 65 years

In terms of unemployment among seniors over 65 years, the demographic groups most similar to Europeans are Immigrants from Iraq (4.9%, a difference of 0.010%), Carpatho Rusyn (4.9%, a difference of 0.060%), Immigrants from Sudan (4.9%, a difference of 0.070%), Danish (4.9%, a difference of 0.10%), and Swedish (4.9%, a difference of 0.12%). Similarly, the demographic groups most similar to Immigrants from Sweden are Kiowa (4.8%, a difference of 0.050%), Swiss (4.8%, a difference of 0.050%), Luxembourger (4.8%, a difference of 0.060%), Macedonian (4.8%, a difference of 0.13%), and Jordanian (4.9%, a difference of 0.15%).
DemographicsRating | RankUnemployment Among Seniors over 65 years
Bulgarians
99.9
/100
|
#37
Exceptional
4.8%
Immigrants | India
99.9
/100
|
#38
Exceptional
4.8%
Macedonians
99.9
/100
|
#39
Exceptional
4.8%
Immigrants | Sweden
99.9
/100
|
#40
Exceptional
4.8%
Kiowa
99.9
/100
|
#41
Exceptional
4.8%
Swiss
99.9
/100
|
#42
Exceptional
4.8%
Luxembourgers
99.9
/100
|
#43
Exceptional
4.8%
Jordanians
99.9
/100
|
#44
Exceptional
4.9%
Ethiopians
99.9
/100
|
#45
Exceptional
4.9%
Immigrants | Jordan
99.9
/100
|
#46
Exceptional
4.9%
Germans
99.9
/100
|
#47
Exceptional
4.9%
Choctaw
99.9
/100
|
#48
Exceptional
4.9%
Immigrants | Kenya
99.9
/100
|
#49
Exceptional
4.9%
Immigrants | Austria
99.9
/100
|
#50
Exceptional
4.9%
Scotch-Irish
99.9
/100
|
#51
Exceptional
4.9%
Swedes
99.9
/100
|
#52
Exceptional
4.9%
Immigrants | Sudan
99.8
/100
|
#53
Exceptional
4.9%
Immigrants | Iraq
99.8
/100
|
#54
Exceptional
4.9%
Europeans
99.8
/100
|
#55
Exceptional
4.9%
Carpatho Rusyns
99.8
/100
|
#56
Exceptional
4.9%
Danes
99.8
/100
|
#57
Exceptional
4.9%