Ethiopian vs Korean Unemployment Among Ages 45 to 54 years

COMPARE

Ethiopian
Race
Ancestry
AfghanAfricanAlaska NativeAlaskan AthabascanAlbanianAleutAlsatianAmericanApacheArabArapahoArgentineanArmenianAssyrian/Chaldean/SyriacAustralianAustrianBahamianBangladeshiBarbadianBasqueBelgianBelizeanBermudanBhutaneseBlackfeetBolivianBrazilianBritishBritish West IndianBulgarianBurmeseCajunCambodianCanadianCape VerdeanCarpatho RusynCelticCentral AmericanCentral American IndianCherokeeCheyenneChickasawChileanChineseChippewaChoctawColombianColvilleComancheCosta RicanCreeCreekCroatianCrowCubanCypriotCzechCzechoslovakianDanishDelawareDominicanDutchDutch West IndianEastern EuropeanEcuadorianEgyptianEnglishEstonianEthiopianEuropeanFijianFilipinoFinnishFrenchFrench American IndianFrench CanadianGermanGerman RussianGhanaianGreekGuamanian/ChamorroGuatemalanGuyaneseHaitianHmongHonduranHopiHoumaHungarianIcelanderIndian (Asian)IndonesianInupiatIranianIraqiIrishIroquoisIsraeliItalianJamaicanJapaneseJordanianKenyanKiowaLaotianLatvianLebaneseLiberianLithuanianLumbeeLuxembourgerMacedonianMalaysianMalteseMarshalleseMenomineeMexicanMexican American IndianMongolianMoroccanNative HawaiianNavajoNepaleseNew ZealanderNicaraguanNigerianNorthern EuropeanNorwegianOkinawanOsageOttawaPaiutePakistaniPalestinianPanamanianParaguayanPennsylvania GermanPeruvianPimaPolishPortuguesePotawatomiPuebloPuerto RicanPuget Sound SalishRomanianRussianSalvadoranSamoanScandinavianScotch-IrishScottishSeminoleSenegaleseSerbianShoshoneSierra LeoneanSiouxSlavicSlovakSloveneSomaliSouth AfricanSouth AmericanSouth American IndianSoviet UnionSpaniardSpanishSpanish AmericanSpanish American IndianSri LankanSubsaharan AfricanSudaneseSwedishSwissSyrianTaiwaneseThaiTlingit-HaidaTohono O'OdhamTonganTrinidadian and TobagonianTsimshianTurkishU.S. Virgin IslanderUgandanUkrainianUruguayanUteVenezuelanVietnameseWelshWest IndianYakamaYaquiYugoslavianYumanYup'ikZimbabwean
Immigration
NonimmigrantsImmigrantsAfghanistanAfricaAlbaniaArgentinaArmeniaAsiaAustraliaAustriaBahamasBangladeshBarbadosBelarusBelgiumBelizeBoliviaBosnia and HerzegovinaBrazilBulgariaBurma/MyanmarCabo VerdeCambodiaCameroonCanadaCaribbeanCentral AmericaChileChinaColombiaCongoCosta RicaCroatiaCubaCzechoslovakiaDenmarkDominicaDominican RepublicEastern AfricaEastern AsiaEastern EuropeEcuadorEgyptEl SalvadorEnglandEritreaEthiopiaEuropeFijiFranceGermanyGhanaGreeceGrenadaGuatemalaGuyanaHaitiHondurasHong KongHungaryIndiaIndonesiaIranIraqIrelandIsraelItalyJamaicaJapanJordanKazakhstanKenyaKoreaKuwaitLaosLatin AmericaLatviaLebanonLiberiaLithuaniaMalaysiaMexicoMicronesiaMiddle AfricaMoldovaMoroccoNepalNetherlandsNicaraguaNigeriaNorth AmericaNorth MacedoniaNorthern AfricaNorthern EuropeNorwayOceaniaPakistanPanamaPeruPhilippinesPolandPortugalRomaniaRussiaSaudi ArabiaScotlandSenegalSerbiaSierra LeoneSingaporeSomaliaSouth AfricaSouth AmericaSouth Central AsiaSouth Eastern AsiaSouthern EuropeSpainSri LankaSt. Vincent and the GrenadinesSudanSwedenSwitzerlandSyriaTaiwanThailandTrinidad and TobagoTurkeyUgandaUkraineUruguayUzbekistanVenezuelaVietnamWest IndiesWestern AfricaWestern AsiaWestern EuropeYemenZaireZimbabweAzores
Korean
Race
Ancestry
AfghanAfricanAlaska NativeAlaskan AthabascanAlbanianAleutAlsatianAmericanApacheArabArapahoArgentineanArmenianAssyrian/Chaldean/SyriacAustralianAustrianBahamianBangladeshiBarbadianBasqueBelgianBelizeanBermudanBhutaneseBlackfeetBolivianBrazilianBritishBritish West IndianBulgarianBurmeseCajunCambodianCanadianCape VerdeanCarpatho RusynCelticCentral AmericanCentral American IndianCherokeeCheyenneChickasawChileanChineseChippewaChoctawColombianColvilleComancheCosta RicanCreeCreekCroatianCrowCubanCypriotCzechCzechoslovakianDanishDelawareDominicanDutchDutch West IndianEastern EuropeanEcuadorianEgyptianEnglishEstonianEuropeanFijianFilipinoFinnishFrenchFrench American IndianFrench CanadianGermanGerman RussianGhanaianGreekGuamanian/ChamorroGuatemalanGuyaneseHaitianHmongHonduranHopiHoumaHungarianIcelanderIndian (Asian)IndonesianInupiatIranianIraqiIrishIroquoisIsraeliItalianJamaicanJapaneseJordanianKenyanKiowaKoreanLaotianLatvianLebaneseLiberianLithuanianLumbeeLuxembourgerMacedonianMalaysianMalteseMarshalleseMenomineeMexicanMexican American IndianMongolianMoroccanNative HawaiianNavajoNepaleseNew ZealanderNicaraguanNigerianNorthern EuropeanNorwegianOkinawanOsageOttawaPaiutePakistaniPalestinianPanamanianParaguayanPennsylvania GermanPeruvianPimaPolishPortuguesePotawatomiPuebloPuerto RicanPuget Sound SalishRomanianRussianSalvadoranSamoanScandinavianScotch-IrishScottishSeminoleSenegaleseSerbianShoshoneSierra LeoneanSiouxSlavicSlovakSloveneSomaliSouth AfricanSouth AmericanSouth American IndianSoviet UnionSpaniardSpanishSpanish AmericanSpanish American IndianSri LankanSubsaharan AfricanSudaneseSwedishSwissSyrianTaiwaneseThaiTlingit-HaidaTohono O'OdhamTonganTrinidadian and TobagonianTsimshianTurkishU.S. Virgin IslanderUgandanUkrainianUruguayanUteVenezuelanVietnameseWelshWest IndianYakamaYaquiYugoslavianYumanYup'ikZimbabwean
Immigration
NonimmigrantsImmigrantsAfghanistanAfricaAlbaniaArgentinaArmeniaAsiaAustraliaAustriaBahamasBangladeshBarbadosBelarusBelgiumBelizeBoliviaBosnia and HerzegovinaBrazilBulgariaBurma/MyanmarCabo VerdeCambodiaCameroonCanadaCaribbeanCentral AmericaChileChinaColombiaCongoCosta RicaCroatiaCubaCzechoslovakiaDenmarkDominicaDominican RepublicEastern AfricaEastern AsiaEastern EuropeEcuadorEgyptEl SalvadorEnglandEritreaEthiopiaEuropeFijiFranceGermanyGhanaGreeceGrenadaGuatemalaGuyanaHaitiHondurasHong KongHungaryIndiaIndonesiaIranIraqIrelandIsraelItalyJamaicaJapanJordanKazakhstanKenyaKoreaKuwaitLaosLatin AmericaLatviaLebanonLiberiaLithuaniaMalaysiaMexicoMicronesiaMiddle AfricaMoldovaMoroccoNepalNetherlandsNicaraguaNigeriaNorth AmericaNorth MacedoniaNorthern AfricaNorthern EuropeNorwayOceaniaPakistanPanamaPeruPhilippinesPolandPortugalRomaniaRussiaSaudi ArabiaScotlandSenegalSerbiaSierra LeoneSingaporeSomaliaSouth AfricaSouth AmericaSouth Central AsiaSouth Eastern AsiaSouthern EuropeSpainSri LankaSt. Vincent and the GrenadinesSudanSwedenSwitzerlandSyriaTaiwanThailandTrinidad and TobagoTurkeyUgandaUkraineUruguayUzbekistanVenezuelaVietnamWest IndiesWestern AfricaWestern AsiaWestern EuropeYemenZaireZimbabweAzores
Unemployment Among Ages 45 to 54 years
Income
Poverty
Unemployment
Labor Participation
Family Structure
Vehicle Availability
Education Level
Disability

Unemployment Among Ages 45 to 54 years Comparison

Ethiopians

Koreans

Exceptional
Good
4.3%
UNEMPLOYMENT AMONG AGES 45 TO 54 YEARS
97.2/ 100
METRIC RATING
86th/ 347
METRIC RANK
4.5%
UNEMPLOYMENT AMONG AGES 45 TO 54 YEARS
73.1/ 100
METRIC RATING
152nd/ 347
METRIC RANK

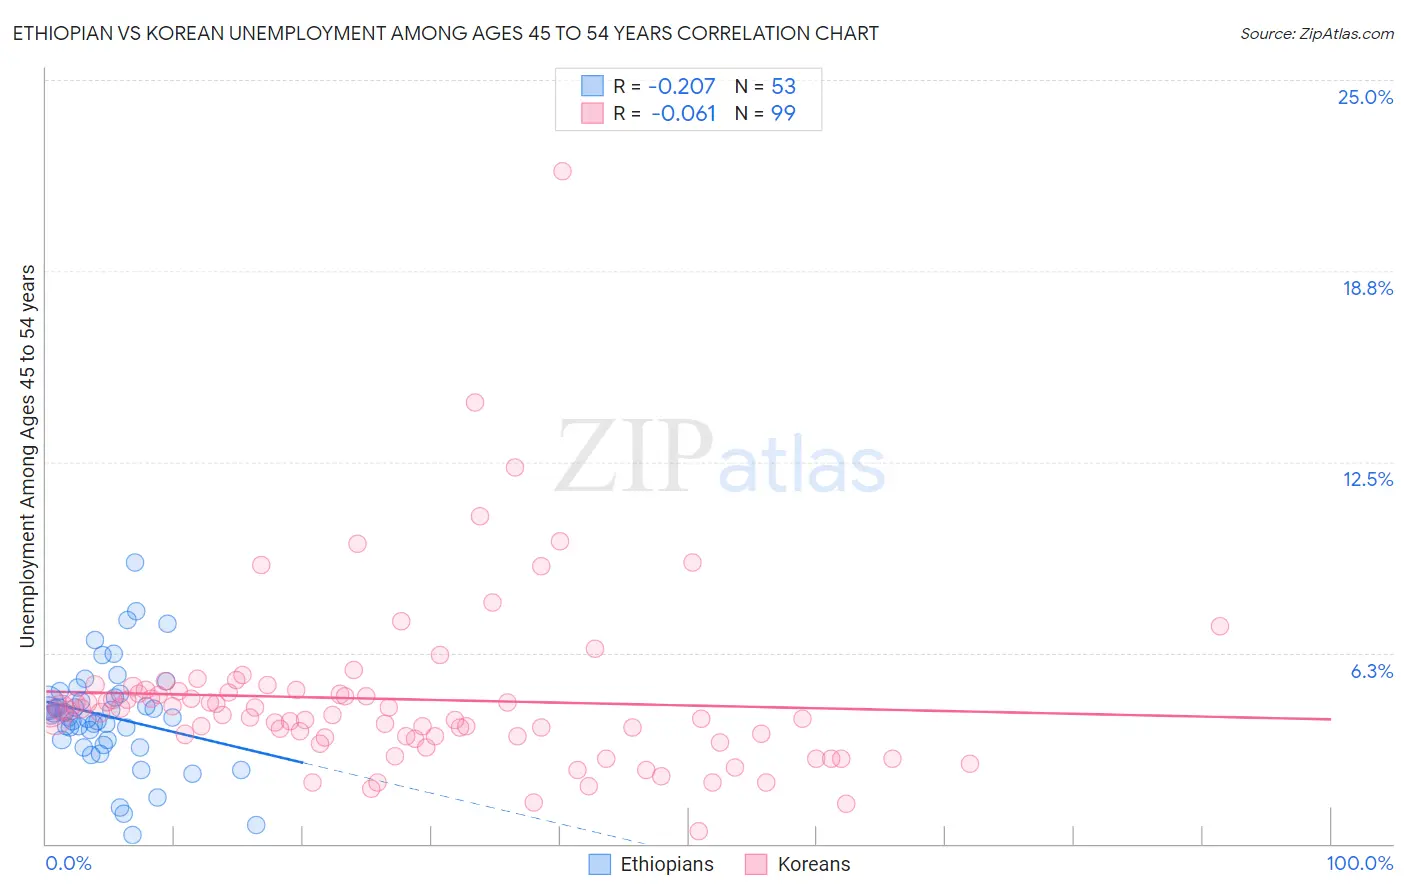
Ethiopian vs Korean Unemployment Among Ages 45 to 54 years Correlation Chart

The statistical analysis conducted on geographies consisting of 220,575,373 people shows a weak negative correlation between the proportion of Ethiopians and unemployment rate among population between the ages 45 and 54 in the United States with a correlation coefficient (R) of -0.207 and weighted average of 4.3%. Similarly, the statistical analysis conducted on geographies consisting of 488,206,822 people shows a slight negative correlation between the proportion of Koreans and unemployment rate among population between the ages 45 and 54 in the United States with a correlation coefficient (R) of -0.061 and weighted average of 4.5%, a difference of 3.1%.
Ethiopian vs Korean Unemployment Among Ages 45 to 54 years

Unemployment Among Ages 45 to 54 years Correlation Summary

MeasurementEthiopianKorean
Minimum0.30%0.40%
Maximum9.2%22.0%
Range8.9%21.6%
Mean4.2%4.7%
Median4.1%4.3%
Interquartile 25% (IQ1)3.3%3.5%
Interquartile 75% (IQ3)4.8%5.0%
Interquartile Range (IQR)1.5%1.5%
Standard Deviation (Sample)1.7%2.8%
Standard Deviation (Population)1.7%2.8%

Similar Demographics by Unemployment Among Ages 45 to 54 years

Demographics Similar to Ethiopians by Unemployment Among Ages 45 to 54 years

In terms of unemployment among ages 45 to 54 years, the demographic groups most similar to Ethiopians are Italian (4.3%, a difference of 0.040%), French (4.3%, a difference of 0.040%), Australian (4.3%, a difference of 0.080%), Sudanese (4.3%, a difference of 0.10%), and Immigrants from Turkey (4.3%, a difference of 0.13%).
DemographicsRating | RankUnemployment Among Ages 45 to 54 years
Serbians
97.9
/100
|
#79
Exceptional
4.3%
Cambodians
97.8
/100
|
#80
Exceptional
4.3%
Immigrants | Micronesia
97.6
/100
|
#81
Exceptional
4.3%
Eastern Europeans
97.6
/100
|
#82
Exceptional
4.3%
Australians
97.4
/100
|
#83
Exceptional
4.3%
Italians
97.3
/100
|
#84
Exceptional
4.3%
French
97.3
/100
|
#85
Exceptional
4.3%
Ethiopians
97.2
/100
|
#86
Exceptional
4.3%
Sudanese
97.0
/100
|
#87
Exceptional
4.3%
Immigrants | Turkey
96.9
/100
|
#88
Exceptional
4.3%
Immigrants | Argentina
96.9
/100
|
#89
Exceptional
4.3%
Asians
96.8
/100
|
#90
Exceptional
4.3%
Ukrainians
96.6
/100
|
#91
Exceptional
4.3%
Mongolians
96.6
/100
|
#92
Exceptional
4.3%
Argentineans
96.5
/100
|
#93
Exceptional
4.3%

Demographics Similar to Koreans by Unemployment Among Ages 45 to 54 years

In terms of unemployment among ages 45 to 54 years, the demographic groups most similar to Koreans are Hungarian (4.5%, a difference of 0.010%), Immigrants from Spain (4.5%, a difference of 0.030%), Cypriot (4.5%, a difference of 0.080%), Tsimshian (4.5%, a difference of 0.10%), and Immigrants from Austria (4.5%, a difference of 0.14%).
DemographicsRating | RankUnemployment Among Ages 45 to 54 years
Immigrants | Latvia
77.5
/100
|
#145
Good
4.5%
Syrians
77.3
/100
|
#146
Good
4.5%
Uruguayans
76.9
/100
|
#147
Good
4.5%
Immigrants | Austria
75.3
/100
|
#148
Good
4.5%
Costa Ricans
75.3
/100
|
#149
Good
4.5%
Tsimshian
74.6
/100
|
#150
Good
4.5%
Cypriots
74.4
/100
|
#151
Good
4.5%
Koreans
73.1
/100
|
#152
Good
4.5%
Hungarians
73.0
/100
|
#153
Good
4.5%
Immigrants | Spain
72.5
/100
|
#154
Good
4.5%
Marshallese
70.6
/100
|
#155
Good
4.5%
Immigrants | Croatia
69.6
/100
|
#156
Good
4.5%
Indians (Asian)
68.1
/100
|
#157
Good
4.5%
Immigrants | Italy
65.5
/100
|
#158
Good
4.5%
Immigrants | Nonimmigrants
62.8
/100
|
#159
Good
4.5%