English vs Romanian Unemployment Among Ages 45 to 54 years
COMPARE
English
Romanian
Unemployment Among Ages 45 to 54 years
Unemployment Among Ages 45 to 54 years Comparison
English
Romanians
4.1%
UNEMPLOYMENT AMONG AGES 45 TO 54 YEARS
100.0/ 100
METRIC RATING
20th/ 347
METRIC RANK
4.4%
UNEMPLOYMENT AMONG AGES 45 TO 54 YEARS
94.9/ 100
METRIC RATING
98th/ 347
METRIC RANK
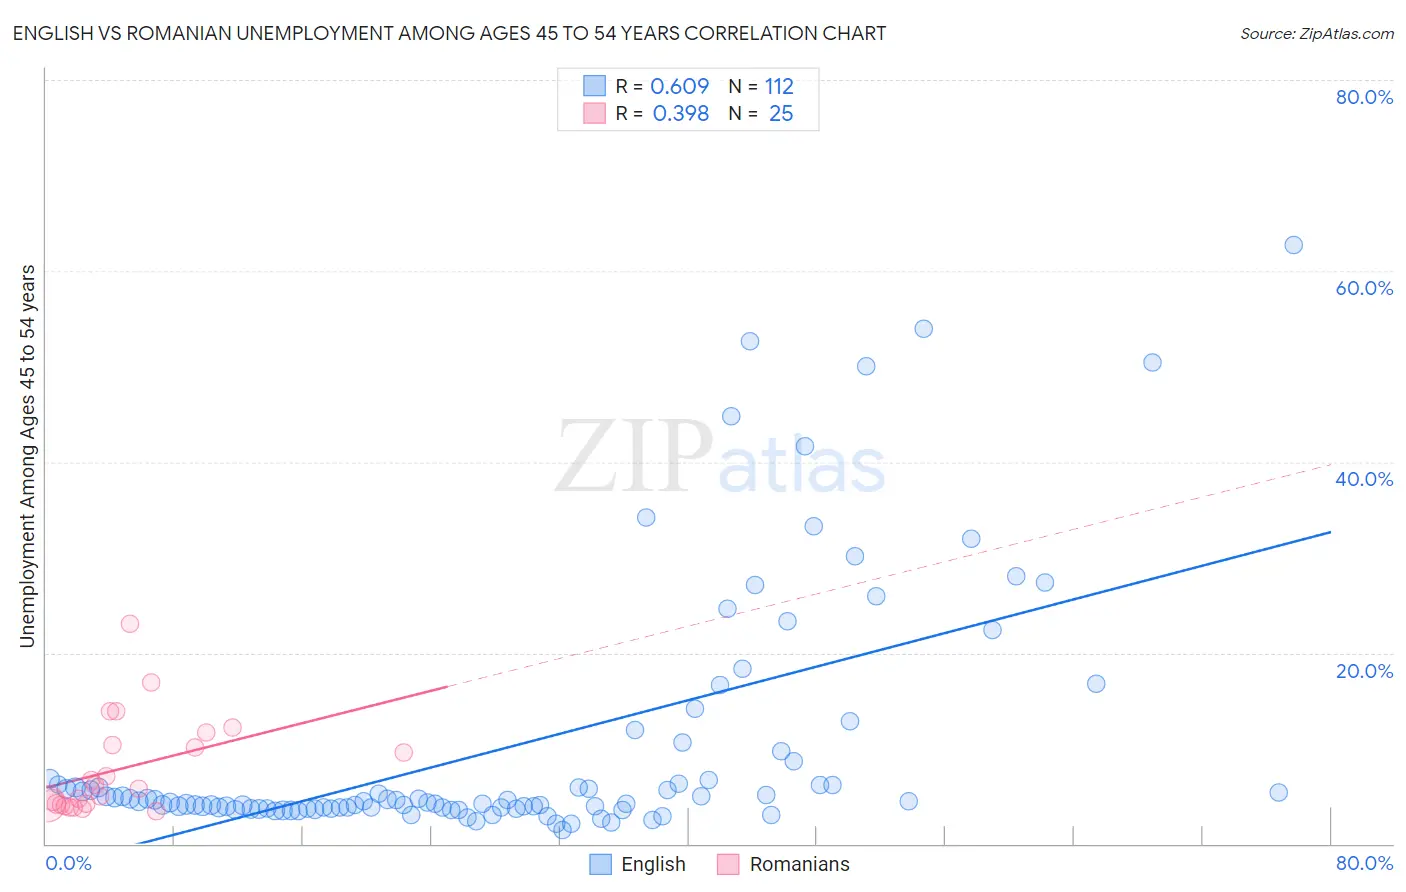
English vs Romanian Unemployment Among Ages 45 to 54 years Correlation Chart
The statistical analysis conducted on geographies consisting of 532,314,880 people shows a significant positive correlation between the proportion of English and unemployment rate among population between the ages 45 and 54 in the United States with a correlation coefficient (R) of 0.609 and weighted average of 4.1%. Similarly, the statistical analysis conducted on geographies consisting of 368,213,038 people shows a mild positive correlation between the proportion of Romanians and unemployment rate among population between the ages 45 and 54 in the United States with a correlation coefficient (R) of 0.398 and weighted average of 4.4%, a difference of 7.2%.
Unemployment Among Ages 45 to 54 years Correlation Summary
| Measurement | English | Romanian |
| Minimum | 1.4% | 3.4% |
| Maximum | 62.7% | 23.0% |
| Range | 61.3% | 19.6% |
| Mean | 10.2% | 7.9% |
| Median | 4.5% | 5.7% |
| Interquartile 25% (IQ1) | 3.7% | 4.1% |
| Interquartile 75% (IQ3) | 6.7% | 11.0% |
| Interquartile Range (IQR) | 3.0% | 6.9% |
| Standard Deviation (Sample) | 13.0% | 5.0% |
| Standard Deviation (Population) | 13.0% | 4.9% |
Similar Demographics by Unemployment Among Ages 45 to 54 years
Demographics Similar to English by Unemployment Among Ages 45 to 54 years
In terms of unemployment among ages 45 to 54 years, the demographic groups most similar to English are Swiss (4.1%, a difference of 0.16%), European (4.1%, a difference of 0.33%), Yugoslavian (4.1%, a difference of 0.42%), Bulgarian (4.1%, a difference of 0.42%), and German (4.1%, a difference of 0.45%).
| Demographics | Rating | Rank | Unemployment Among Ages 45 to 54 years |
| Cubans | 100.0 /100 | #13 | Exceptional 4.0% |
| Immigrants | Bosnia and Herzegovina | 100.0 /100 | #14 | Exceptional 4.0% |
| Immigrants | Bolivia | 100.0 /100 | #15 | Exceptional 4.0% |
| Thais | 100.0 /100 | #16 | Exceptional 4.0% |
| Tongans | 100.0 /100 | #17 | Exceptional 4.1% |
| Germans | 100.0 /100 | #18 | Exceptional 4.1% |
| Swiss | 100.0 /100 | #19 | Exceptional 4.1% |
| English | 100.0 /100 | #20 | Exceptional 4.1% |
| Europeans | 100.0 /100 | #21 | Exceptional 4.1% |
| Yugoslavians | 100.0 /100 | #22 | Exceptional 4.1% |
| Bulgarians | 100.0 /100 | #23 | Exceptional 4.1% |
| Carpatho Rusyns | 100.0 /100 | #24 | Exceptional 4.1% |
| Bolivians | 99.9 /100 | #25 | Exceptional 4.1% |
| Scottish | 99.9 /100 | #26 | Exceptional 4.1% |
| Immigrants | Moldova | 99.9 /100 | #27 | Exceptional 4.1% |
Demographics Similar to Romanians by Unemployment Among Ages 45 to 54 years
In terms of unemployment among ages 45 to 54 years, the demographic groups most similar to Romanians are Immigrants from Canada (4.4%, a difference of 0.010%), Immigrants from Burma/Myanmar (4.4%, a difference of 0.020%), Immigrants from Eritrea (4.4%, a difference of 0.050%), Indonesian (4.4%, a difference of 0.13%), and Immigrants from North America (4.4%, a difference of 0.24%).
| Demographics | Rating | Rank | Unemployment Among Ages 45 to 54 years |
| Ukrainians | 96.6 /100 | #91 | Exceptional 4.3% |
| Mongolians | 96.6 /100 | #92 | Exceptional 4.3% |
| Argentineans | 96.5 /100 | #93 | Exceptional 4.3% |
| Immigrants | Malaysia | 96.2 /100 | #94 | Exceptional 4.4% |
| Immigrants | Ethiopia | 96.1 /100 | #95 | Exceptional 4.4% |
| Indonesians | 95.4 /100 | #96 | Exceptional 4.4% |
| Immigrants | Canada | 95.0 /100 | #97 | Exceptional 4.4% |
| Romanians | 94.9 /100 | #98 | Exceptional 4.4% |
| Immigrants | Burma/Myanmar | 94.9 /100 | #99 | Exceptional 4.4% |
| Immigrants | Eritrea | 94.7 /100 | #100 | Exceptional 4.4% |
| Immigrants | North America | 93.9 /100 | #101 | Exceptional 4.4% |
| Sri Lankans | 93.7 /100 | #102 | Exceptional 4.4% |
| Icelanders | 93.5 /100 | #103 | Exceptional 4.4% |
| Immigrants | Sweden | 93.0 /100 | #104 | Exceptional 4.4% |
| Immigrants | Kenya | 92.8 /100 | #105 | Exceptional 4.4% |