English vs Immigrants from Nigeria Unemployment Among Ages 20 to 24 years
COMPARE
English
Immigrants from Nigeria
Unemployment Among Ages 20 to 24 years
Unemployment Among Ages 20 to 24 years Comparison
English
Immigrants from Nigeria
9.8%
UNEMPLOYMENT AMONG AGES 20 TO 24 YEARS
99.5/ 100
METRIC RATING
59th/ 347
METRIC RANK
11.5%
UNEMPLOYMENT AMONG AGES 20 TO 24 YEARS
0.0/ 100
METRIC RATING
273rd/ 347
METRIC RANK
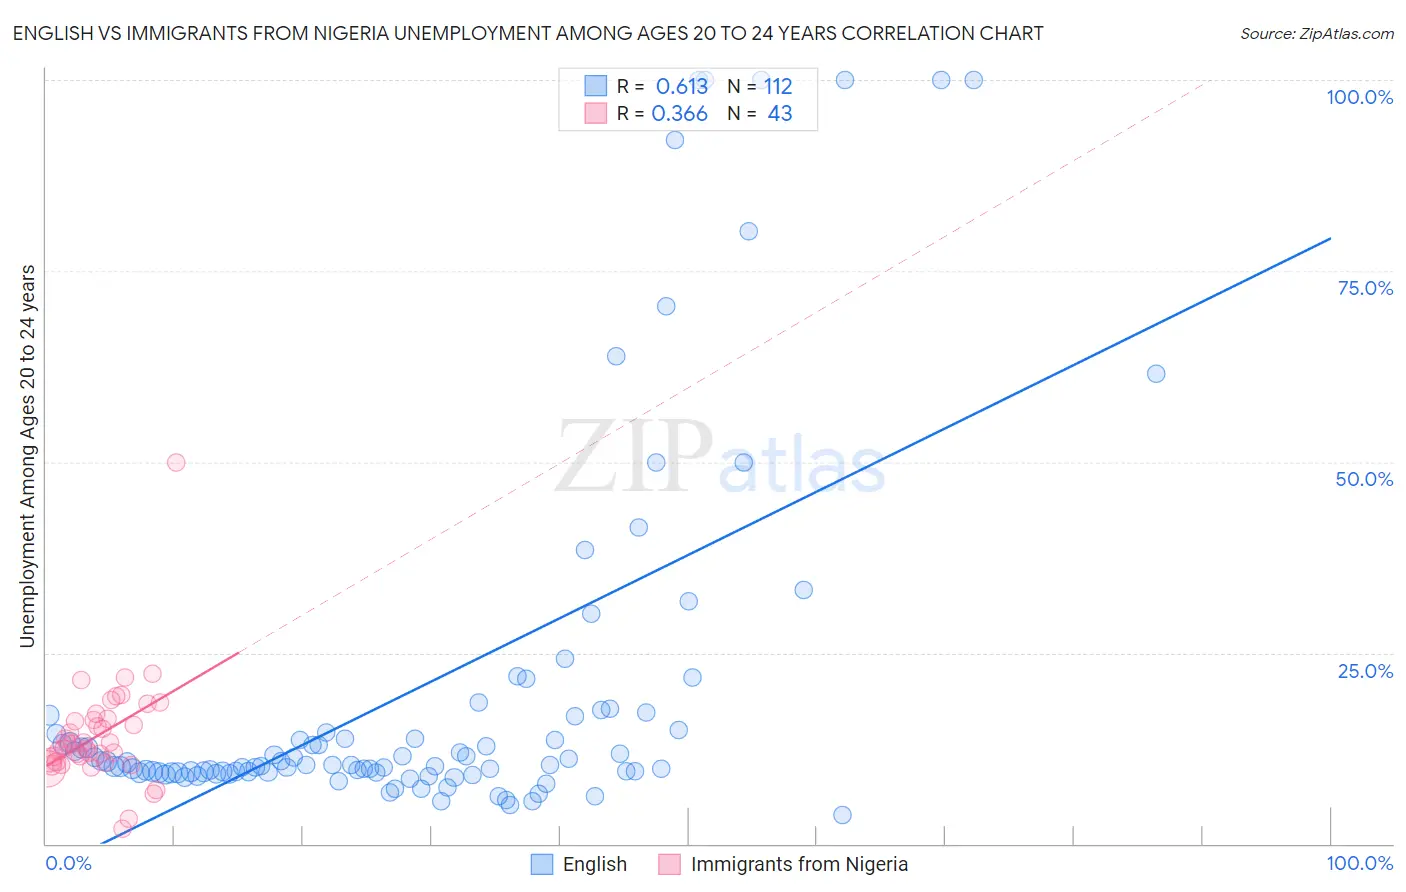
English vs Immigrants from Nigeria Unemployment Among Ages 20 to 24 years Correlation Chart
The statistical analysis conducted on geographies consisting of 526,770,694 people shows a significant positive correlation between the proportion of English and unemployment rate among population between the ages 20 and 24 in the United States with a correlation coefficient (R) of 0.613 and weighted average of 9.8%. Similarly, the statistical analysis conducted on geographies consisting of 279,785,675 people shows a mild positive correlation between the proportion of Immigrants from Nigeria and unemployment rate among population between the ages 20 and 24 in the United States with a correlation coefficient (R) of 0.366 and weighted average of 11.5%, a difference of 17.0%.
Unemployment Among Ages 20 to 24 years Correlation Summary
| Measurement | English | Immigrants from Nigeria |
| Minimum | 3.8% | 2.0% |
| Maximum | 100.0% | 50.0% |
| Range | 96.2% | 48.0% |
| Mean | 20.3% | 14.2% |
| Median | 10.4% | 13.1% |
| Interquartile 25% (IQ1) | 9.3% | 10.7% |
| Interquartile 75% (IQ3) | 15.8% | 16.3% |
| Interquartile Range (IQR) | 6.5% | 5.6% |
| Standard Deviation (Sample) | 24.3% | 7.1% |
| Standard Deviation (Population) | 24.2% | 7.0% |
Similar Demographics by Unemployment Among Ages 20 to 24 years
Demographics Similar to English by Unemployment Among Ages 20 to 24 years
In terms of unemployment among ages 20 to 24 years, the demographic groups most similar to English are Pakistani (9.8%, a difference of 0.0%), Immigrants from Kuwait (9.8%, a difference of 0.030%), Immigrants from Moldova (9.8%, a difference of 0.050%), Malaysian (9.8%, a difference of 0.050%), and Immigrants from Singapore (9.8%, a difference of 0.15%).
| Demographics | Rating | Rank | Unemployment Among Ages 20 to 24 years |
| Immigrants | Thailand | 99.7 /100 | #52 | Exceptional 9.8% |
| Immigrants | Serbia | 99.6 /100 | #53 | Exceptional 9.8% |
| Immigrants | Cambodia | 99.6 /100 | #54 | Exceptional 9.8% |
| Carpatho Rusyns | 99.6 /100 | #55 | Exceptional 9.8% |
| Nicaraguans | 99.6 /100 | #56 | Exceptional 9.8% |
| Immigrants | Moldova | 99.5 /100 | #57 | Exceptional 9.8% |
| Pakistanis | 99.5 /100 | #58 | Exceptional 9.8% |
| English | 99.5 /100 | #59 | Exceptional 9.8% |
| Immigrants | Kuwait | 99.5 /100 | #60 | Exceptional 9.8% |
| Malaysians | 99.5 /100 | #61 | Exceptional 9.8% |
| Immigrants | Singapore | 99.4 /100 | #62 | Exceptional 9.8% |
| British | 99.4 /100 | #63 | Exceptional 9.8% |
| Serbians | 99.4 /100 | #64 | Exceptional 9.8% |
| Welsh | 99.3 /100 | #65 | Exceptional 9.8% |
| Scottish | 99.3 /100 | #66 | Exceptional 9.8% |
Demographics Similar to Immigrants from Nigeria by Unemployment Among Ages 20 to 24 years
In terms of unemployment among ages 20 to 24 years, the demographic groups most similar to Immigrants from Nigeria are Cape Verdean (11.5%, a difference of 0.080%), Senegalese (11.5%, a difference of 0.44%), Sierra Leonean (11.5%, a difference of 0.48%), Nigerian (11.4%, a difference of 0.61%), and African (11.5%, a difference of 0.62%).
| Demographics | Rating | Rank | Unemployment Among Ages 20 to 24 years |
| Immigrants | Liberia | 0.0 /100 | #266 | Tragic 11.1% |
| Immigrants | Greece | 0.0 /100 | #267 | Tragic 11.1% |
| Maltese | 0.0 /100 | #268 | Tragic 11.2% |
| Ute | 0.0 /100 | #269 | Tragic 11.2% |
| Delaware | 0.0 /100 | #270 | Tragic 11.3% |
| Immigrants | Uzbekistan | 0.0 /100 | #271 | Tragic 11.4% |
| Nigerians | 0.0 /100 | #272 | Tragic 11.4% |
| Immigrants | Nigeria | 0.0 /100 | #273 | Tragic 11.5% |
| Cape Verdeans | 0.0 /100 | #274 | Tragic 11.5% |
| Senegalese | 0.0 /100 | #275 | Tragic 11.5% |
| Sierra Leoneans | 0.0 /100 | #276 | Tragic 11.5% |
| Africans | 0.0 /100 | #277 | Tragic 11.5% |
| Colville | 0.0 /100 | #278 | Tragic 11.6% |
| Bahamians | 0.0 /100 | #279 | Tragic 11.6% |
| Alaskan Athabascans | 0.0 /100 | #280 | Tragic 11.6% |