Egyptian vs Taiwanese Unemployment Among Ages 16 to 19 years
COMPARE
Egyptian
Taiwanese
Unemployment Among Ages 16 to 19 years
Unemployment Among Ages 16 to 19 years Comparison
Egyptians
Taiwanese
17.5%
UNEMPLOYMENT AMONG AGES 16 TO 19 YEARS
59.7/ 100
METRIC RATING
163rd/ 347
METRIC RANK
15.5%
UNEMPLOYMENT AMONG AGES 16 TO 19 YEARS
100.0/ 100
METRIC RATING
12th/ 347
METRIC RANK
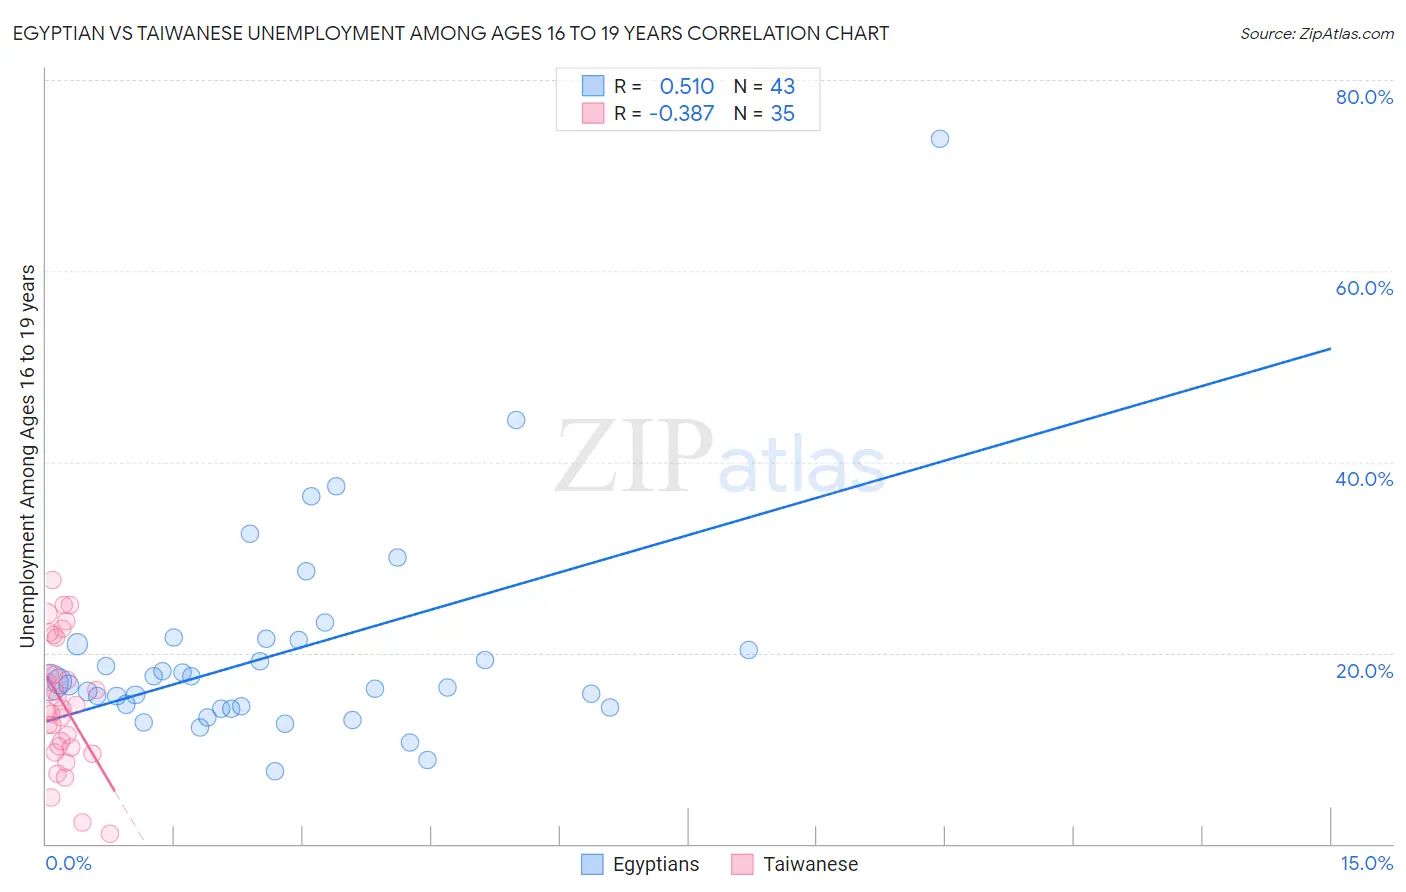
Egyptian vs Taiwanese Unemployment Among Ages 16 to 19 years Correlation Chart
The statistical analysis conducted on geographies consisting of 267,383,543 people shows a substantial positive correlation between the proportion of Egyptians and unemployment rate among population between the ages 16 and 19 in the United States with a correlation coefficient (R) of 0.510 and weighted average of 17.5%. Similarly, the statistical analysis conducted on geographies consisting of 31,481,670 people shows a mild negative correlation between the proportion of Taiwanese and unemployment rate among population between the ages 16 and 19 in the United States with a correlation coefficient (R) of -0.387 and weighted average of 15.5%, a difference of 12.7%.
Unemployment Among Ages 16 to 19 years Correlation Summary
| Measurement | Egyptian | Taiwanese |
| Minimum | 7.6% | 1.1% |
| Maximum | 73.9% | 27.6% |
| Range | 66.3% | 26.5% |
| Mean | 20.1% | 14.8% |
| Median | 16.9% | 14.2% |
| Interquartile 25% (IQ1) | 14.3% | 10.1% |
| Interquartile 75% (IQ3) | 21.4% | 21.7% |
| Interquartile Range (IQR) | 7.1% | 11.6% |
| Standard Deviation (Sample) | 11.3% | 6.7% |
| Standard Deviation (Population) | 11.2% | 6.6% |
Similar Demographics by Unemployment Among Ages 16 to 19 years
Demographics Similar to Egyptians by Unemployment Among Ages 16 to 19 years
In terms of unemployment among ages 16 to 19 years, the demographic groups most similar to Egyptians are Immigrants from Norway (17.5%, a difference of 0.0%), Immigrants from Denmark (17.5%, a difference of 0.030%), Ukrainian (17.5%, a difference of 0.040%), Korean (17.5%, a difference of 0.060%), and Immigrants from Austria (17.5%, a difference of 0.10%).
| Demographics | Rating | Rank | Unemployment Among Ages 16 to 19 years |
| Costa Ricans | 65.9 /100 | #156 | Good 17.4% |
| Uruguayans | 64.3 /100 | #157 | Good 17.5% |
| Immigrants | China | 64.1 /100 | #158 | Good 17.5% |
| Koreans | 61.0 /100 | #159 | Good 17.5% |
| Ukrainians | 60.5 /100 | #160 | Good 17.5% |
| Immigrants | Denmark | 60.3 /100 | #161 | Good 17.5% |
| Immigrants | Norway | 59.8 /100 | #162 | Average 17.5% |
| Egyptians | 59.7 /100 | #163 | Average 17.5% |
| Immigrants | Austria | 57.7 /100 | #164 | Average 17.5% |
| Cape Verdeans | 55.8 /100 | #165 | Average 17.5% |
| Immigrants | Italy | 55.2 /100 | #166 | Average 17.5% |
| Immigrants | France | 54.9 /100 | #167 | Average 17.5% |
| Immigrants | Hungary | 54.7 /100 | #168 | Average 17.5% |
| Immigrants | Cambodia | 54.5 /100 | #169 | Average 17.5% |
| Immigrants | Romania | 53.3 /100 | #170 | Average 17.5% |
Demographics Similar to Taiwanese by Unemployment Among Ages 16 to 19 years
In terms of unemployment among ages 16 to 19 years, the demographic groups most similar to Taiwanese are Indonesian (15.5%, a difference of 0.10%), Immigrants from Burma/Myanmar (15.6%, a difference of 0.43%), Zimbabwean (15.4%, a difference of 0.52%), Immigrants from Zaire (15.6%, a difference of 0.58%), and Scandinavian (15.4%, a difference of 0.63%).
| Demographics | Rating | Rank | Unemployment Among Ages 16 to 19 years |
| Immigrants | Somalia | 100.0 /100 | #5 | Exceptional 15.3% |
| Swedes | 100.0 /100 | #6 | Exceptional 15.3% |
| Immigrants | Bosnia and Herzegovina | 100.0 /100 | #7 | Exceptional 15.3% |
| Czechs | 100.0 /100 | #8 | Exceptional 15.4% |
| Scandinavians | 100.0 /100 | #9 | Exceptional 15.4% |
| Zimbabweans | 100.0 /100 | #10 | Exceptional 15.4% |
| Indonesians | 100.0 /100 | #11 | Exceptional 15.5% |
| Taiwanese | 100.0 /100 | #12 | Exceptional 15.5% |
| Immigrants | Burma/Myanmar | 100.0 /100 | #13 | Exceptional 15.6% |
| Immigrants | Zaire | 100.0 /100 | #14 | Exceptional 15.6% |
| Yugoslavians | 100.0 /100 | #15 | Exceptional 15.6% |
| Germans | 100.0 /100 | #16 | Exceptional 15.7% |
| Somalis | 100.0 /100 | #17 | Exceptional 15.7% |
| Thais | 100.0 /100 | #18 | Exceptional 15.7% |
| Swiss | 100.0 /100 | #19 | Exceptional 15.8% |