Ecuadorian vs Immigrants from Peru Unemployment Among Seniors over 65 years

COMPARE

Ecuadorian
Race
Ancestry
AfghanAfricanAlaska NativeAlaskan AthabascanAlbanianAleutAlsatianAmericanApacheArabArapahoArgentineanArmenianAssyrian/Chaldean/SyriacAustralianAustrianBahamianBangladeshiBarbadianBasqueBelgianBelizeanBermudanBhutaneseBlackfeetBolivianBrazilianBritishBritish West IndianBulgarianBurmeseCajunCambodianCanadianCape VerdeanCarpatho RusynCelticCentral AmericanCentral American IndianCherokeeCheyenneChickasawChileanChineseChippewaChoctawColombianColvilleComancheCosta RicanCreeCreekCroatianCrowCubanCypriotCzechCzechoslovakianDanishDelawareDominicanDutchDutch West IndianEastern EuropeanEcuadorianEgyptianEnglishEstonianEthiopianEuropeanFijianFilipinoFinnishFrenchFrench American IndianFrench CanadianGermanGerman RussianGhanaianGreekGuamanian/ChamorroGuatemalanGuyaneseHaitianHmongHonduranHopiHoumaHungarianIcelanderIndian (Asian)IndonesianInupiatIranianIraqiIrishIroquoisIsraeliItalianJamaicanJapaneseJordanianKenyanKiowaKoreanLaotianLatvianLebaneseLiberianLithuanianLumbeeLuxembourgerMacedonianMalaysianMalteseMarshalleseMenomineeMexicanMexican American IndianMongolianMoroccanNative HawaiianNavajoNepaleseNew ZealanderNicaraguanNigerianNorthern EuropeanNorwegianOkinawanOsageOttawaPaiutePakistaniPalestinianPanamanianParaguayanPennsylvania GermanPeruvianPimaPolishPortuguesePotawatomiPuebloPuerto RicanPuget Sound SalishRomanianRussianSalvadoranSamoanScandinavianScotch-IrishScottishSeminoleSenegaleseSerbianShoshoneSierra LeoneanSiouxSlavicSlovakSloveneSomaliSouth AfricanSouth AmericanSouth American IndianSoviet UnionSpaniardSpanishSpanish AmericanSpanish American IndianSri LankanSubsaharan AfricanSudaneseSwedishSwissSyrianTaiwaneseThaiTlingit-HaidaTohono O'OdhamTonganTrinidadian and TobagonianTsimshianTurkishU.S. Virgin IslanderUgandanUkrainianUruguayanUteVenezuelanVietnameseWelshWest IndianYakamaYaquiYugoslavianYumanYup'ikZimbabwean
Immigration
NonimmigrantsImmigrantsAfghanistanAfricaAlbaniaArgentinaArmeniaAsiaAustraliaAustriaBahamasBangladeshBarbadosBelarusBelgiumBelizeBoliviaBosnia and HerzegovinaBrazilBulgariaBurma/MyanmarCabo VerdeCambodiaCameroonCanadaCaribbeanCentral AmericaChileChinaColombiaCongoCosta RicaCroatiaCubaCzechoslovakiaDenmarkDominicaDominican RepublicEastern AfricaEastern AsiaEastern EuropeEcuadorEgyptEl SalvadorEnglandEritreaEthiopiaEuropeFijiFranceGermanyGhanaGreeceGrenadaGuatemalaGuyanaHaitiHondurasHong KongHungaryIndiaIndonesiaIranIraqIrelandIsraelItalyJamaicaJapanJordanKazakhstanKenyaKoreaKuwaitLaosLatin AmericaLatviaLebanonLiberiaLithuaniaMalaysiaMexicoMicronesiaMiddle AfricaMoldovaMoroccoNepalNetherlandsNicaraguaNigeriaNorth AmericaNorth MacedoniaNorthern AfricaNorthern EuropeNorwayOceaniaPakistanPanamaPhilippinesPolandPortugalRomaniaRussiaSaudi ArabiaScotlandSenegalSerbiaSierra LeoneSingaporeSomaliaSouth AfricaSouth AmericaSouth Central AsiaSouth Eastern AsiaSouthern EuropeSpainSri LankaSt. Vincent and the GrenadinesSudanSwedenSwitzerlandSyriaTaiwanThailandTrinidad and TobagoTurkeyUgandaUkraineUruguayUzbekistanVenezuelaVietnamWest IndiesWestern AfricaWestern AsiaWestern EuropeYemenZaireZimbabweAzores
Immigrants from Peru
Race
Ancestry
AfghanAfricanAlaska NativeAlaskan AthabascanAlbanianAleutAlsatianAmericanApacheArabArapahoArgentineanArmenianAssyrian/Chaldean/SyriacAustralianAustrianBahamianBangladeshiBarbadianBasqueBelgianBelizeanBermudanBhutaneseBlackfeetBolivianBrazilianBritishBritish West IndianBulgarianBurmeseCajunCambodianCanadianCape VerdeanCarpatho RusynCelticCentral AmericanCentral American IndianCherokeeCheyenneChickasawChileanChineseChippewaChoctawColombianColvilleComancheCosta RicanCreeCreekCroatianCrowCubanCypriotCzechCzechoslovakianDanishDelawareDominicanDutchDutch West IndianEastern EuropeanEgyptianEnglishEstonianEthiopianEuropeanFijianFilipinoFinnishFrenchFrench American IndianFrench CanadianGermanGerman RussianGhanaianGreekGuamanian/ChamorroGuatemalanGuyaneseHaitianHmongHonduranHopiHoumaHungarianIcelanderIndian (Asian)IndonesianInupiatIranianIraqiIrishIroquoisIsraeliItalianJamaicanJapaneseJordanianKenyanKiowaKoreanLaotianLatvianLebaneseLiberianLithuanianLumbeeLuxembourgerMacedonianMalaysianMalteseMarshalleseMenomineeMexicanMexican American IndianMongolianMoroccanNative HawaiianNavajoNepaleseNew ZealanderNicaraguanNigerianNorthern EuropeanNorwegianOkinawanOsageOttawaPaiutePakistaniPalestinianPanamanianParaguayanPennsylvania GermanPeruvianPimaPolishPortuguesePotawatomiPuebloPuerto RicanPuget Sound SalishRomanianRussianSalvadoranSamoanScandinavianScotch-IrishScottishSeminoleSenegaleseSerbianShoshoneSierra LeoneanSiouxSlavicSlovakSloveneSomaliSouth AfricanSouth AmericanSouth American IndianSoviet UnionSpaniardSpanishSpanish AmericanSpanish American IndianSri LankanSubsaharan AfricanSudaneseSwedishSwissSyrianTaiwaneseThaiTlingit-HaidaTohono O'OdhamTonganTrinidadian and TobagonianTsimshianTurkishU.S. Virgin IslanderUgandanUkrainianUruguayanUteVenezuelanVietnameseWelshWest IndianYakamaYaquiYugoslavianYumanYup'ikZimbabwean
Immigration
NonimmigrantsImmigrantsAfghanistanAfricaAlbaniaArgentinaArmeniaAsiaAustraliaAustriaBahamasBangladeshBarbadosBelarusBelgiumBelizeBoliviaBosnia and HerzegovinaBrazilBulgariaBurma/MyanmarCabo VerdeCambodiaCameroonCanadaCaribbeanCentral AmericaChileChinaColombiaCongoCosta RicaCroatiaCubaCzechoslovakiaDenmarkDominicaDominican RepublicEastern AfricaEastern AsiaEastern EuropeEcuadorEgyptEl SalvadorEnglandEritreaEthiopiaEuropeFijiFranceGermanyGhanaGreeceGrenadaGuatemalaGuyanaHaitiHondurasHong KongHungaryIndiaIndonesiaIranIraqIrelandIsraelItalyJamaicaJapanJordanKazakhstanKenyaKoreaKuwaitLaosLatin AmericaLatviaLebanonLiberiaLithuaniaMalaysiaMexicoMicronesiaMiddle AfricaMoldovaMoroccoNepalNetherlandsNicaraguaNigeriaNorth AmericaNorth MacedoniaNorthern AfricaNorthern EuropeNorwayOceaniaPakistanPanamaPeruPhilippinesPolandPortugalRomaniaRussiaSaudi ArabiaScotlandSenegalSerbiaSierra LeoneSingaporeSomaliaSouth AfricaSouth AmericaSouth Central AsiaSouth Eastern AsiaSouthern EuropeSpainSri LankaSt. Vincent and the GrenadinesSudanSwedenSwitzerlandSyriaTaiwanThailandTrinidad and TobagoTurkeyUgandaUkraineUruguayUzbekistanVenezuelaVietnamWest IndiesWestern AfricaWestern AsiaWestern EuropeYemenZaireZimbabweAzores
Unemployment Among Seniors over 65 years
Income
Poverty
Unemployment
Labor Participation
Family Structure
Vehicle Availability
Education Level
Disability

Unemployment Among Seniors over 65 years Comparison

Ecuadorians

Immigrants from Peru

Tragic
Tragic
5.6%
UNEMPLOYMENT AMONG SENIORS OVER 65 YEARS
0.0/ 100
METRIC RATING
306th/ 347
METRIC RANK
5.4%
UNEMPLOYMENT AMONG SENIORS OVER 65 YEARS
0.5/ 100
METRIC RATING
255th/ 347
METRIC RANK

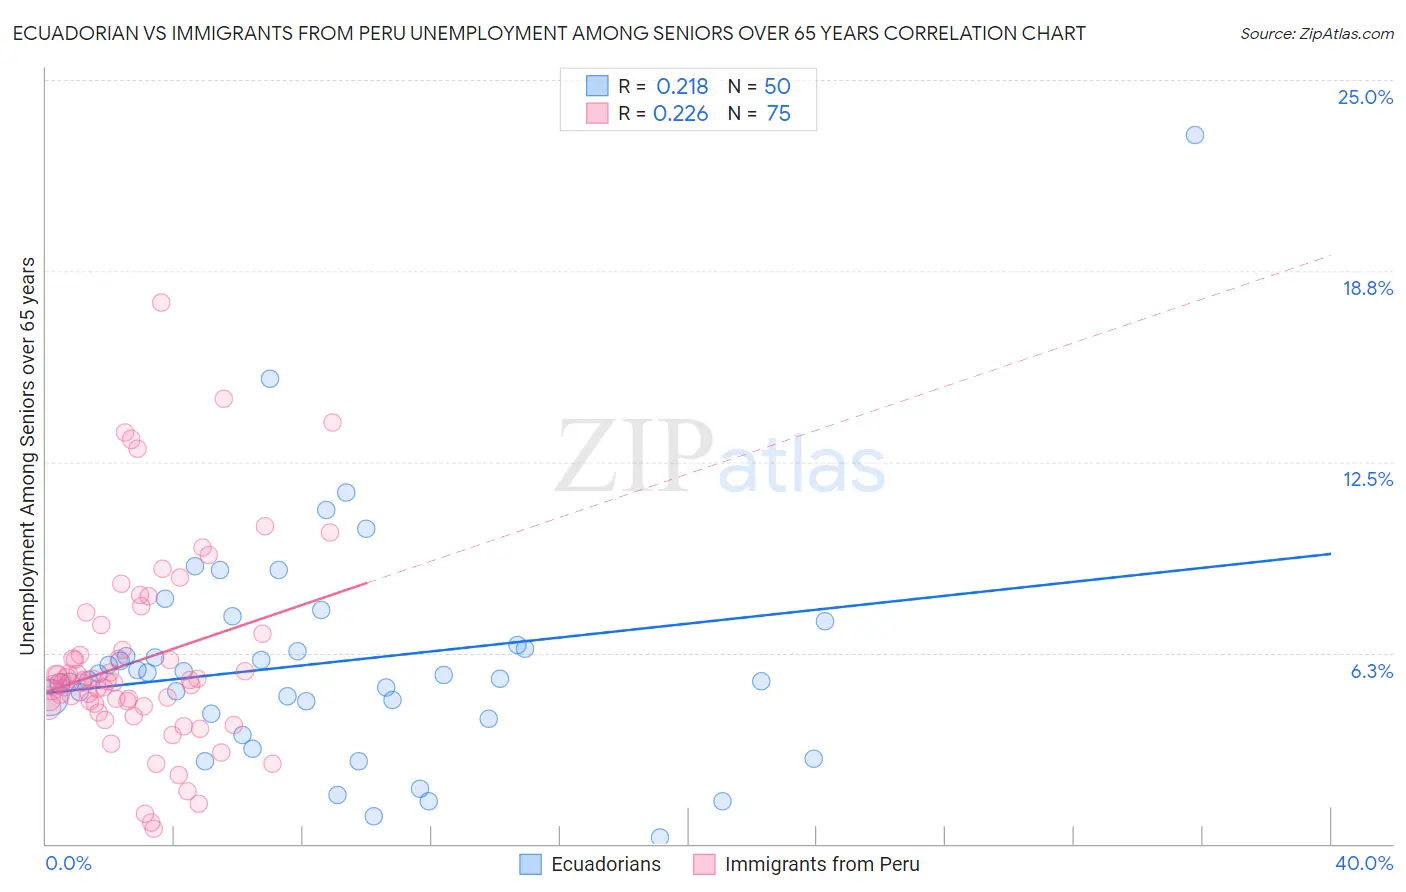
Ecuadorian vs Immigrants from Peru Unemployment Among Seniors over 65 years Correlation Chart

The statistical analysis conducted on geographies consisting of 294,826,024 people shows a weak positive correlation between the proportion of Ecuadorians and unemployment rate amomg seniors over the age of 65 in the United States with a correlation coefficient (R) of 0.218 and weighted average of 5.6%. Similarly, the statistical analysis conducted on geographies consisting of 305,441,687 people shows a weak positive correlation between the proportion of Immigrants from Peru and unemployment rate amomg seniors over the age of 65 in the United States with a correlation coefficient (R) of 0.226 and weighted average of 5.4%, a difference of 4.4%.
Ecuadorian vs Immigrants from Peru Unemployment Among Seniors over 65 years

Unemployment Among Seniors over 65 years Correlation Summary

MeasurementEcuadorianImmigrants from Peru
Minimum0.20%0.50%
Maximum23.2%17.7%
Range23.0%17.2%
Mean5.9%6.0%
Median5.5%5.3%
Interquartile 25% (IQ1)4.2%4.5%
Interquartile 75% (IQ3)6.5%6.9%
Interquartile Range (IQR)2.3%2.3%
Standard Deviation (Sample)3.8%3.2%
Standard Deviation (Population)3.7%3.2%

Similar Demographics by Unemployment Among Seniors over 65 years

Demographics Similar to Ecuadorians by Unemployment Among Seniors over 65 years

In terms of unemployment among seniors over 65 years, the demographic groups most similar to Ecuadorians are Mexican (5.6%, a difference of 0.040%), Portuguese (5.6%, a difference of 0.050%), Immigrants from St. Vincent and the Grenadines (5.6%, a difference of 0.14%), Liberian (5.6%, a difference of 0.21%), and Immigrants from Latin America (5.6%, a difference of 0.28%).
DemographicsRating | RankUnemployment Among Seniors over 65 years
Guyanese
0.0
/100
|
#299
Tragic
5.6%
Zimbabweans
0.0
/100
|
#300
Tragic
5.6%
Hispanics or Latinos
0.0
/100
|
#301
Tragic
5.6%
Guatemalans
0.0
/100
|
#302
Tragic
5.6%
Immigrants | Latin America
0.0
/100
|
#303
Tragic
5.6%
Liberians
0.0
/100
|
#304
Tragic
5.6%
Mexicans
0.0
/100
|
#305
Tragic
5.6%
Ecuadorians
0.0
/100
|
#306
Tragic
5.6%
Portuguese
0.0
/100
|
#307
Tragic
5.6%
Immigrants | St. Vincent and the Grenadines
0.0
/100
|
#308
Tragic
5.6%
Immigrants | Guatemala
0.0
/100
|
#309
Tragic
5.6%
Salvadorans
0.0
/100
|
#310
Tragic
5.6%
Immigrants | Guyana
0.0
/100
|
#311
Tragic
5.6%
Immigrants | Ecuador
0.0
/100
|
#312
Tragic
5.6%
Barbadians
0.0
/100
|
#313
Tragic
5.6%

Demographics Similar to Immigrants from Peru by Unemployment Among Seniors over 65 years

In terms of unemployment among seniors over 65 years, the demographic groups most similar to Immigrants from Peru are Paraguayan (5.4%, a difference of 0.010%), Moroccan (5.4%, a difference of 0.030%), Immigrants from Sierra Leone (5.4%, a difference of 0.070%), Trinidadian and Tobagonian (5.4%, a difference of 0.090%), and Immigrants from Micronesia (5.4%, a difference of 0.12%).
DemographicsRating | RankUnemployment Among Seniors over 65 years
French Canadians
0.7
/100
|
#248
Tragic
5.4%
Immigrants | Immigrants
0.6
/100
|
#249
Tragic
5.4%
Ghanaians
0.6
/100
|
#250
Tragic
5.4%
West Indians
0.6
/100
|
#251
Tragic
5.4%
Trinidadians and Tobagonians
0.6
/100
|
#252
Tragic
5.4%
Immigrants | Sierra Leone
0.6
/100
|
#253
Tragic
5.4%
Paraguayans
0.5
/100
|
#254
Tragic
5.4%
Immigrants | Peru
0.5
/100
|
#255
Tragic
5.4%
Moroccans
0.5
/100
|
#256
Tragic
5.4%
Immigrants | Micronesia
0.4
/100
|
#257
Tragic
5.4%
Sierra Leoneans
0.4
/100
|
#258
Tragic
5.4%
Immigrants | Ghana
0.4
/100
|
#259
Tragic
5.4%
Native Hawaiians
0.3
/100
|
#260
Tragic
5.4%
Spanish American Indians
0.2
/100
|
#261
Tragic
5.4%
Immigrants | Grenada
0.2
/100
|
#262
Tragic
5.4%