Ecuadorian vs Afghan Unemployment Among Ages 45 to 54 years
COMPARE
Ecuadorian
Afghan
Unemployment Among Ages 45 to 54 years
Unemployment Among Ages 45 to 54 years Comparison
Ecuadorians
Afghans
5.3%
UNEMPLOYMENT AMONG AGES 45 TO 54 YEARS
0.0/ 100
METRIC RATING
299th/ 347
METRIC RANK
4.4%
UNEMPLOYMENT AMONG AGES 45 TO 54 YEARS
84.6/ 100
METRIC RATING
134th/ 347
METRIC RANK
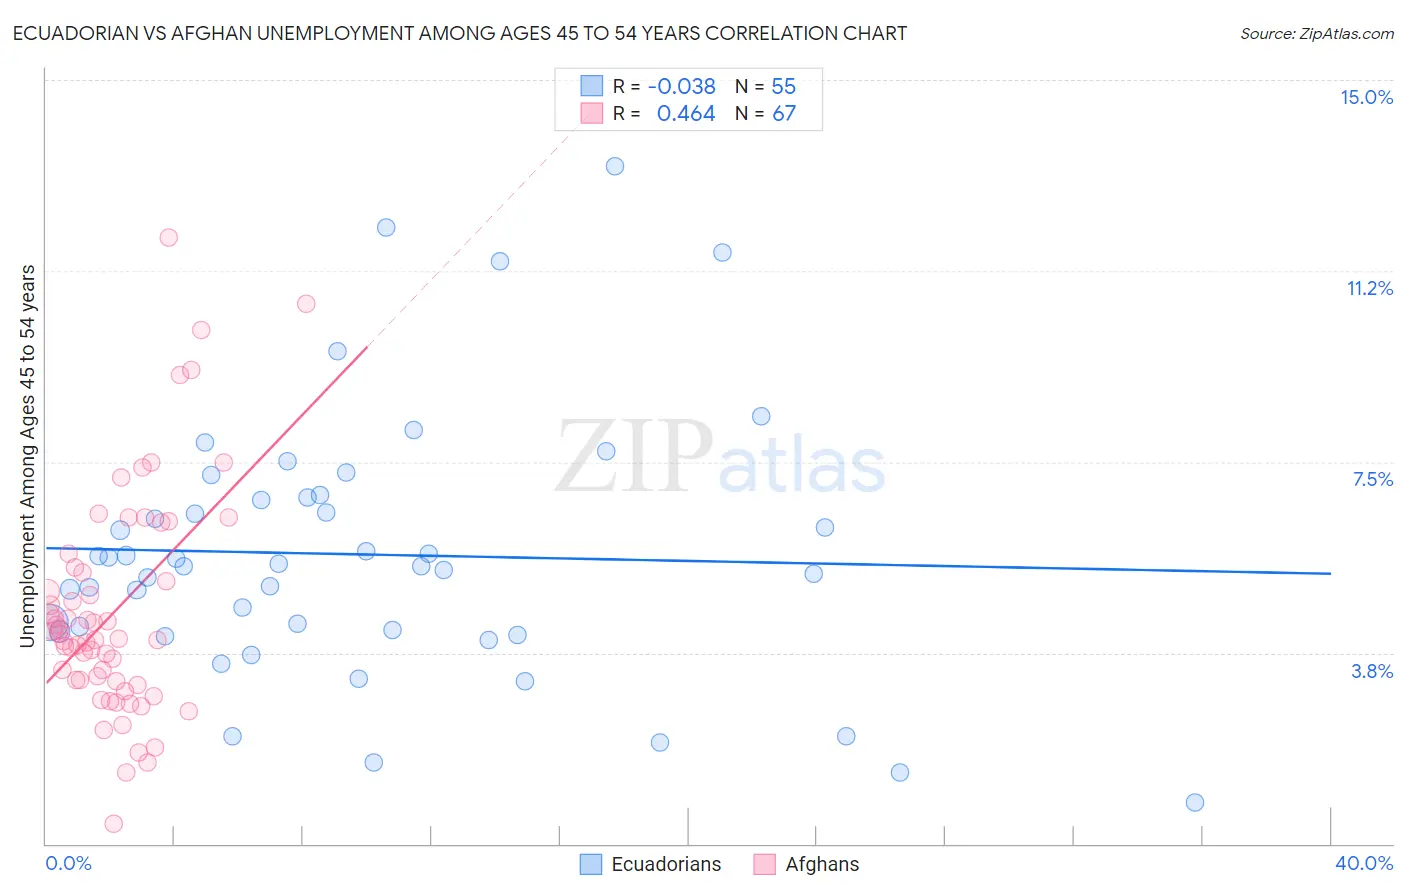
Ecuadorian vs Afghan Unemployment Among Ages 45 to 54 years Correlation Chart
The statistical analysis conducted on geographies consisting of 312,530,580 people shows no correlation between the proportion of Ecuadorians and unemployment rate among population between the ages 45 and 54 in the United States with a correlation coefficient (R) of -0.038 and weighted average of 5.3%. Similarly, the statistical analysis conducted on geographies consisting of 147,840,349 people shows a moderate positive correlation between the proportion of Afghans and unemployment rate among population between the ages 45 and 54 in the United States with a correlation coefficient (R) of 0.464 and weighted average of 4.4%, a difference of 19.0%.
Unemployment Among Ages 45 to 54 years Correlation Summary
| Measurement | Ecuadorian | Afghan |
| Minimum | 0.80% | 0.40% |
| Maximum | 13.3% | 11.9% |
| Range | 12.5% | 11.5% |
| Mean | 5.7% | 4.6% |
| Median | 5.4% | 4.0% |
| Interquartile 25% (IQ1) | 4.2% | 3.2% |
| Interquartile 75% (IQ3) | 6.8% | 5.4% |
| Interquartile Range (IQR) | 2.6% | 2.2% |
| Standard Deviation (Sample) | 2.6% | 2.2% |
| Standard Deviation (Population) | 2.6% | 2.2% |
Similar Demographics by Unemployment Among Ages 45 to 54 years
Demographics Similar to Ecuadorians by Unemployment Among Ages 45 to 54 years
In terms of unemployment among ages 45 to 54 years, the demographic groups most similar to Ecuadorians are Immigrants from Trinidad and Tobago (5.3%, a difference of 0.020%), Aleut (5.3%, a difference of 0.14%), West Indian (5.3%, a difference of 0.14%), Central American Indian (5.3%, a difference of 0.21%), and Jamaican (5.3%, a difference of 0.33%).
| Demographics | Rating | Rank | Unemployment Among Ages 45 to 54 years |
| Trinidadians and Tobagonians | 0.0 /100 | #292 | Tragic 5.2% |
| Immigrants | Senegal | 0.0 /100 | #293 | Tragic 5.2% |
| Belizeans | 0.0 /100 | #294 | Tragic 5.2% |
| Jamaicans | 0.0 /100 | #295 | Tragic 5.3% |
| Aleuts | 0.0 /100 | #296 | Tragic 5.3% |
| West Indians | 0.0 /100 | #297 | Tragic 5.3% |
| Immigrants | Trinidad and Tobago | 0.0 /100 | #298 | Tragic 5.3% |
| Ecuadorians | 0.0 /100 | #299 | Tragic 5.3% |
| Central American Indians | 0.0 /100 | #300 | Tragic 5.3% |
| Menominee | 0.0 /100 | #301 | Tragic 5.3% |
| Immigrants | Ecuador | 0.0 /100 | #302 | Tragic 5.3% |
| Immigrants | Belize | 0.0 /100 | #303 | Tragic 5.3% |
| Immigrants | Jamaica | 0.0 /100 | #304 | Tragic 5.4% |
| Immigrants | West Indies | 0.0 /100 | #305 | Tragic 5.4% |
| Immigrants | Bangladesh | 0.0 /100 | #306 | Tragic 5.4% |
Demographics Similar to Afghans by Unemployment Among Ages 45 to 54 years
In terms of unemployment among ages 45 to 54 years, the demographic groups most similar to Afghans are Immigrants from Cameroon (4.4%, a difference of 0.020%), Immigrants from Eastern Africa (4.4%, a difference of 0.050%), Immigrants from Eastern Asia (4.4%, a difference of 0.050%), Immigrants from Middle Africa (4.4%, a difference of 0.11%), and Immigrants from Germany (4.4%, a difference of 0.12%).
| Demographics | Rating | Rank | Unemployment Among Ages 45 to 54 years |
| Nicaraguans | 87.6 /100 | #127 | Excellent 4.4% |
| Immigrants | Northern Europe | 86.9 /100 | #128 | Excellent 4.4% |
| Laotians | 86.3 /100 | #129 | Excellent 4.4% |
| Celtics | 86.2 /100 | #130 | Excellent 4.4% |
| Immigrants | Germany | 85.9 /100 | #131 | Excellent 4.4% |
| Immigrants | Eastern Africa | 85.1 /100 | #132 | Excellent 4.4% |
| Immigrants | Cameroon | 84.8 /100 | #133 | Excellent 4.4% |
| Afghans | 84.6 /100 | #134 | Excellent 4.4% |
| Immigrants | Eastern Asia | 84.0 /100 | #135 | Excellent 4.4% |
| Immigrants | Middle Africa | 83.3 /100 | #136 | Excellent 4.4% |
| Lebanese | 81.9 /100 | #137 | Excellent 4.4% |
| Immigrants | Congo | 81.8 /100 | #138 | Excellent 4.4% |
| Immigrants | Kuwait | 81.7 /100 | #139 | Excellent 4.4% |
| Immigrants | Zaire | 80.7 /100 | #140 | Excellent 4.4% |
| Immigrants | Afghanistan | 79.6 /100 | #141 | Good 4.4% |