Eastern European vs Immigrants from Panama Unemployment Among Ages 16 to 19 years
COMPARE
Eastern European
Immigrants from Panama
Unemployment Among Ages 16 to 19 years
Unemployment Among Ages 16 to 19 years Comparison
Eastern Europeans
Immigrants from Panama
17.6%
UNEMPLOYMENT AMONG AGES 16 TO 19 YEARS
44.3/ 100
METRIC RATING
184th/ 347
METRIC RANK
19.3%
UNEMPLOYMENT AMONG AGES 16 TO 19 YEARS
0.0/ 100
METRIC RATING
273rd/ 347
METRIC RANK
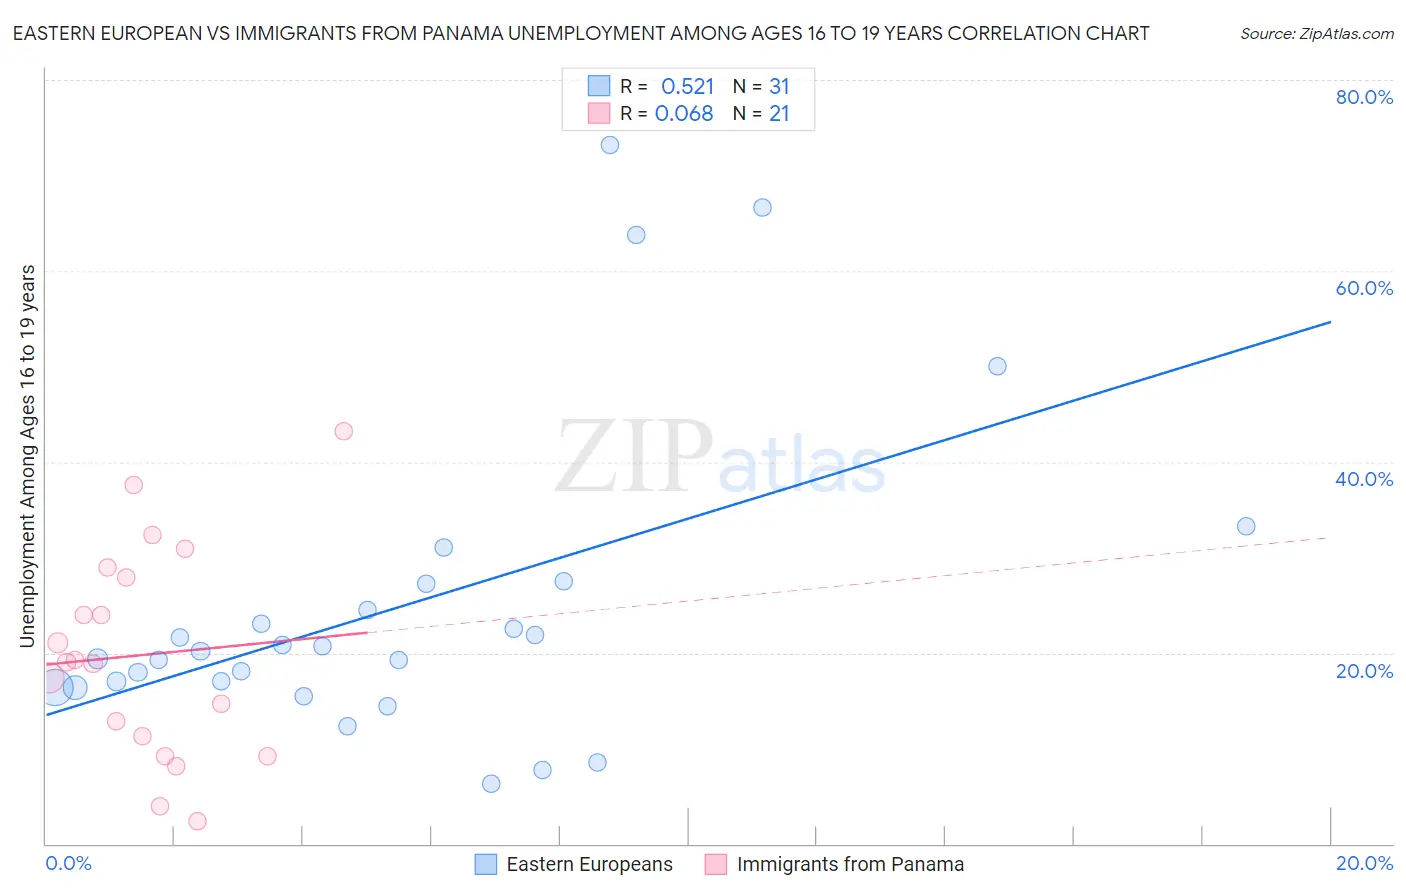
Eastern European vs Immigrants from Panama Unemployment Among Ages 16 to 19 years Correlation Chart
The statistical analysis conducted on geographies consisting of 427,327,922 people shows a substantial positive correlation between the proportion of Eastern Europeans and unemployment rate among population between the ages 16 and 19 in the United States with a correlation coefficient (R) of 0.521 and weighted average of 17.6%. Similarly, the statistical analysis conducted on geographies consisting of 215,440,567 people shows a slight positive correlation between the proportion of Immigrants from Panama and unemployment rate among population between the ages 16 and 19 in the United States with a correlation coefficient (R) of 0.068 and weighted average of 19.3%, a difference of 9.4%.
Unemployment Among Ages 16 to 19 years Correlation Summary
| Measurement | Eastern European | Immigrants from Panama |
| Minimum | 6.2% | 2.3% |
| Maximum | 73.2% | 43.2% |
| Range | 67.0% | 40.9% |
| Mean | 24.9% | 19.8% |
| Median | 20.1% | 19.1% |
| Interquartile 25% (IQ1) | 16.4% | 10.2% |
| Interquartile 75% (IQ3) | 27.2% | 28.4% |
| Interquartile Range (IQR) | 10.8% | 18.2% |
| Standard Deviation (Sample) | 16.5% | 11.0% |
| Standard Deviation (Population) | 16.2% | 10.7% |
Similar Demographics by Unemployment Among Ages 16 to 19 years
Demographics Similar to Eastern Europeans by Unemployment Among Ages 16 to 19 years
In terms of unemployment among ages 16 to 19 years, the demographic groups most similar to Eastern Europeans are Immigrants from Uruguay (17.6%, a difference of 0.020%), Iroquois (17.6%, a difference of 0.040%), Russian (17.6%, a difference of 0.050%), Japanese (17.6%, a difference of 0.050%), and Immigrants from Turkey (17.6%, a difference of 0.060%).
| Demographics | Rating | Rank | Unemployment Among Ages 16 to 19 years |
| Bermudans | 48.7 /100 | #177 | Average 17.6% |
| Celtics | 48.7 /100 | #178 | Average 17.6% |
| Americans | 47.4 /100 | #179 | Average 17.6% |
| Spaniards | 47.1 /100 | #180 | Average 17.6% |
| Immigrants | Turkey | 45.6 /100 | #181 | Average 17.6% |
| Russians | 45.2 /100 | #182 | Average 17.6% |
| Immigrants | Uruguay | 44.6 /100 | #183 | Average 17.6% |
| Eastern Europeans | 44.3 /100 | #184 | Average 17.6% |
| Iroquois | 43.4 /100 | #185 | Average 17.6% |
| Japanese | 43.2 /100 | #186 | Average 17.6% |
| Immigrants | Micronesia | 42.4 /100 | #187 | Average 17.6% |
| Immigrants | Nicaragua | 42.2 /100 | #188 | Average 17.6% |
| Immigrants | Europe | 41.8 /100 | #189 | Average 17.6% |
| Marshallese | 41.7 /100 | #190 | Average 17.6% |
| Immigrants | Costa Rica | 41.3 /100 | #191 | Average 17.6% |
Demographics Similar to Immigrants from Panama by Unemployment Among Ages 16 to 19 years
In terms of unemployment among ages 16 to 19 years, the demographic groups most similar to Immigrants from Panama are Hispanic or Latino (19.2%, a difference of 0.13%), Shoshone (19.3%, a difference of 0.15%), Blackfeet (19.2%, a difference of 0.25%), Paraguayan (19.4%, a difference of 0.47%), and Immigrants from Latin America (19.4%, a difference of 0.57%).
| Demographics | Rating | Rank | Unemployment Among Ages 16 to 19 years |
| Immigrants | Honduras | 0.1 /100 | #266 | Tragic 19.0% |
| Israelis | 0.1 /100 | #267 | Tragic 19.0% |
| Immigrants | El Salvador | 0.1 /100 | #268 | Tragic 19.1% |
| Lumbee | 0.1 /100 | #269 | Tragic 19.1% |
| Hondurans | 0.1 /100 | #270 | Tragic 19.2% |
| Blackfeet | 0.0 /100 | #271 | Tragic 19.2% |
| Hispanics or Latinos | 0.0 /100 | #272 | Tragic 19.2% |
| Immigrants | Panama | 0.0 /100 | #273 | Tragic 19.3% |
| Shoshone | 0.0 /100 | #274 | Tragic 19.3% |
| Paraguayans | 0.0 /100 | #275 | Tragic 19.4% |
| Immigrants | Latin America | 0.0 /100 | #276 | Tragic 19.4% |
| Immigrants | Western Africa | 0.0 /100 | #277 | Tragic 19.4% |
| Africans | 0.0 /100 | #278 | Tragic 19.5% |
| Ute | 0.0 /100 | #279 | Tragic 19.6% |
| Cajuns | 0.0 /100 | #280 | Tragic 19.6% |