Dutch West Indian vs Liberian Unemployment Among Women with Children Under 18 years
COMPARE
Dutch West Indian
Liberian
Unemployment Among Women with Children Under 18 years
Unemployment Among Women with Children Under 18 years Comparison
Dutch West Indians
Liberians
6.2%
UNEMPLOYMENT AMONG WOMEN WITH CHILDREN UNDER 18 YEARS
0.0/ 100
METRIC RATING
275th/ 347
METRIC RANK
6.0%
UNEMPLOYMENT AMONG WOMEN WITH CHILDREN UNDER 18 YEARS
0.2/ 100
METRIC RATING
255th/ 347
METRIC RANK
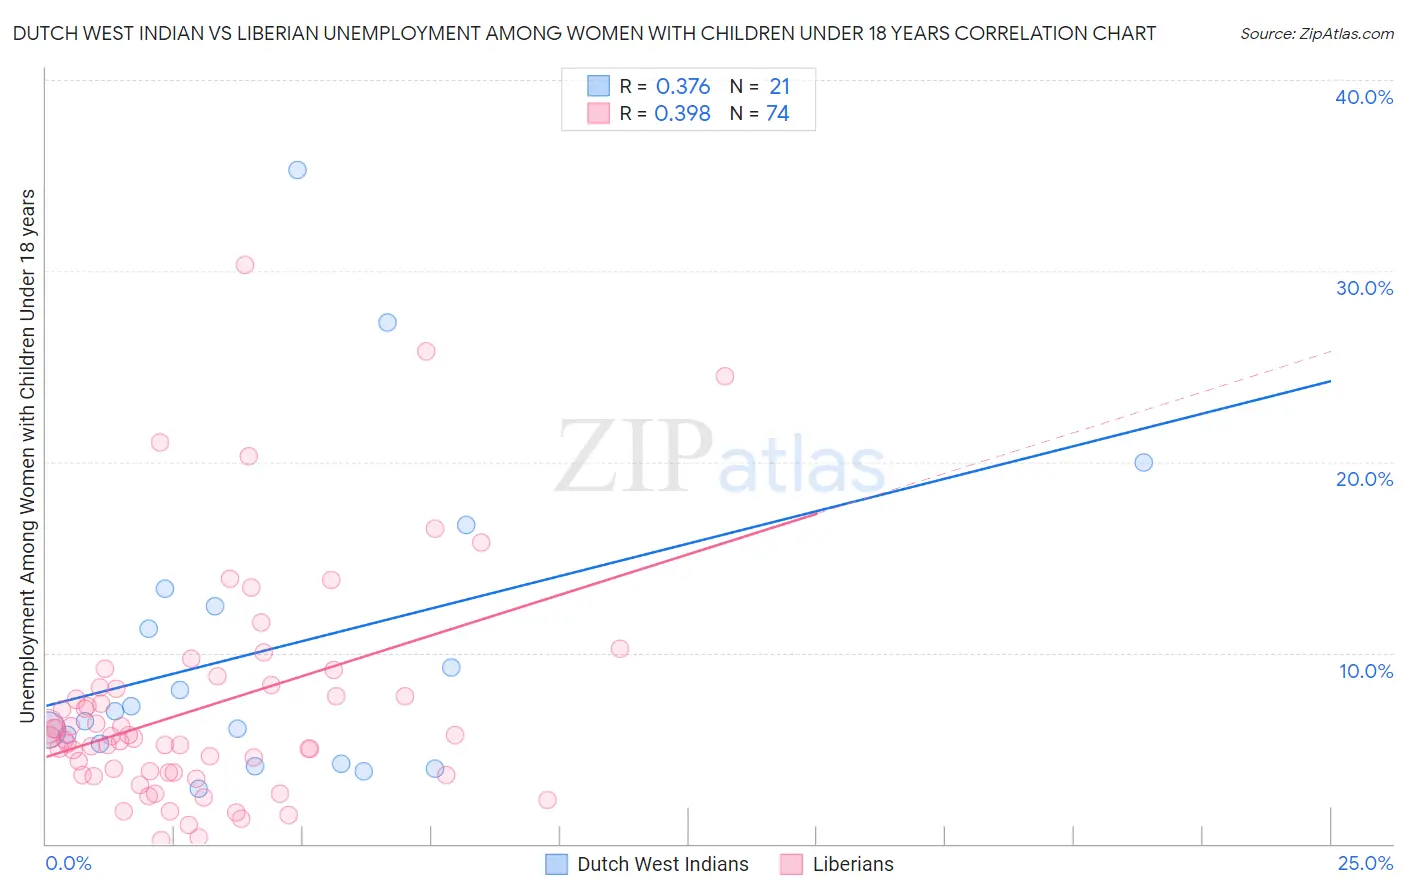
Dutch West Indian vs Liberian Unemployment Among Women with Children Under 18 years Correlation Chart
The statistical analysis conducted on geographies consisting of 84,109,270 people shows a mild positive correlation between the proportion of Dutch West Indians and unemployment rate among women with children under the age of 18 in the United States with a correlation coefficient (R) of 0.376 and weighted average of 6.2%. Similarly, the statistical analysis conducted on geographies consisting of 116,844,166 people shows a mild positive correlation between the proportion of Liberians and unemployment rate among women with children under the age of 18 in the United States with a correlation coefficient (R) of 0.398 and weighted average of 6.0%, a difference of 3.1%.
Unemployment Among Women with Children Under 18 years Correlation Summary
| Measurement | Dutch West Indian | Liberian |
| Minimum | 2.9% | 0.20% |
| Maximum | 35.3% | 30.3% |
| Range | 32.4% | 30.1% |
| Mean | 10.3% | 7.2% |
| Median | 6.9% | 5.6% |
| Interquartile 25% (IQ1) | 4.7% | 3.7% |
| Interquartile 75% (IQ3) | 12.9% | 8.2% |
| Interquartile Range (IQR) | 8.1% | 4.5% |
| Standard Deviation (Sample) | 8.4% | 5.8% |
| Standard Deviation (Population) | 8.2% | 5.8% |
Demographics Similar to Dutch West Indians and Liberians by Unemployment Among Women with Children Under 18 years
In terms of unemployment among women with children under 18 years, the demographic groups most similar to Dutch West Indians are Senegalese (6.2%, a difference of 0.18%), Immigrants from Western Africa (6.2%, a difference of 0.19%), Salvadoran (6.2%, a difference of 0.28%), Central American (6.2%, a difference of 0.50%), and Cajun (6.2%, a difference of 0.81%). Similarly, the demographic groups most similar to Liberians are Nepalese (6.0%, a difference of 0.080%), Bermudan (6.1%, a difference of 0.61%), Immigrants from Nigeria (6.1%, a difference of 0.79%), Ottawa (6.1%, a difference of 1.5%), and Nigerian (6.1%, a difference of 1.5%).
| Demographics | Rating | Rank | Unemployment Among Women with Children Under 18 years |
| Liberians | 0.2 /100 | #255 | Tragic 6.0% |
| Nepalese | 0.2 /100 | #256 | Tragic 6.0% |
| Bermudans | 0.1 /100 | #257 | Tragic 6.1% |
| Immigrants | Nigeria | 0.1 /100 | #258 | Tragic 6.1% |
| Ottawa | 0.1 /100 | #259 | Tragic 6.1% |
| Nigerians | 0.1 /100 | #260 | Tragic 6.1% |
| Immigrants | Liberia | 0.1 /100 | #261 | Tragic 6.1% |
| Immigrants | Trinidad and Tobago | 0.1 /100 | #262 | Tragic 6.1% |
| Spanish American Indians | 0.1 /100 | #263 | Tragic 6.1% |
| Comanche | 0.1 /100 | #264 | Tragic 6.1% |
| Immigrants | Bahamas | 0.1 /100 | #265 | Tragic 6.1% |
| Sub-Saharan Africans | 0.1 /100 | #266 | Tragic 6.2% |
| French American Indians | 0.1 /100 | #267 | Tragic 6.2% |
| Trinidadians and Tobagonians | 0.1 /100 | #268 | Tragic 6.2% |
| Cajuns | 0.1 /100 | #269 | Tragic 6.2% |
| Ghanaians | 0.1 /100 | #270 | Tragic 6.2% |
| Central Americans | 0.0 /100 | #271 | Tragic 6.2% |
| Salvadorans | 0.0 /100 | #272 | Tragic 6.2% |
| Immigrants | Western Africa | 0.0 /100 | #273 | Tragic 6.2% |
| Senegalese | 0.0 /100 | #274 | Tragic 6.2% |
| Dutch West Indians | 0.0 /100 | #275 | Tragic 6.2% |