Dutch West Indian vs Immigrants from Lithuania Unemployment Among Ages 30 to 34 years
COMPARE
Dutch West Indian
Immigrants from Lithuania
Unemployment Among Ages 30 to 34 years
Unemployment Among Ages 30 to 34 years Comparison
Dutch West Indians
Immigrants from Lithuania
6.6%
UNEMPLOYMENT AMONG AGES 30 TO 34 YEARS
0.0/ 100
METRIC RATING
299th/ 347
METRIC RANK
5.2%
UNEMPLOYMENT AMONG AGES 30 TO 34 YEARS
95.0/ 100
METRIC RATING
79th/ 347
METRIC RANK
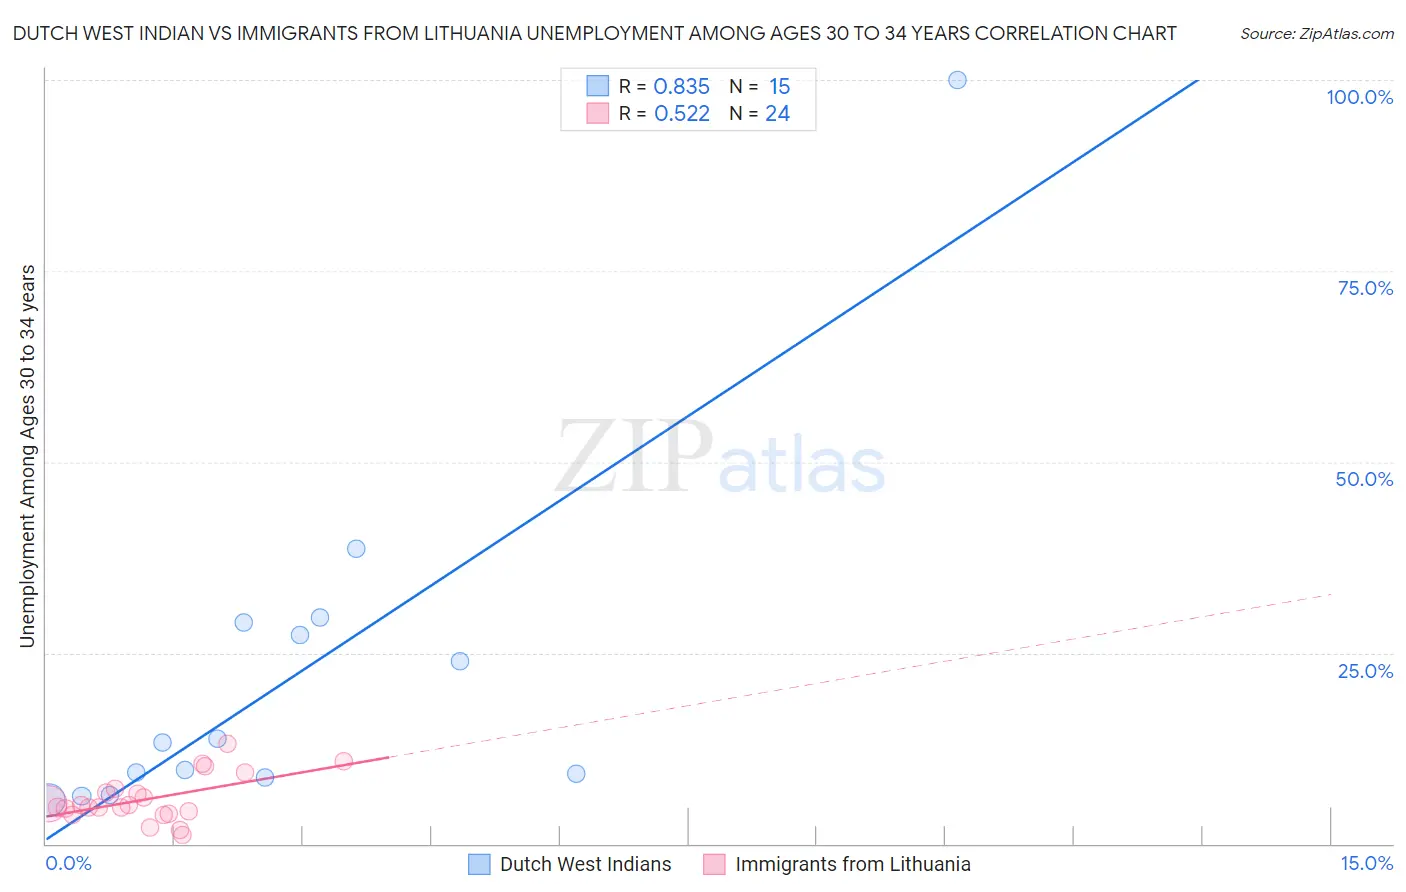
Dutch West Indian vs Immigrants from Lithuania Unemployment Among Ages 30 to 34 years Correlation Chart
The statistical analysis conducted on geographies consisting of 82,832,966 people shows a very strong positive correlation between the proportion of Dutch West Indians and unemployment rate among population between the ages 30 and 34 in the United States with a correlation coefficient (R) of 0.835 and weighted average of 6.6%. Similarly, the statistical analysis conducted on geographies consisting of 114,688,670 people shows a substantial positive correlation between the proportion of Immigrants from Lithuania and unemployment rate among population between the ages 30 and 34 in the United States with a correlation coefficient (R) of 0.522 and weighted average of 5.2%, a difference of 26.9%.
Unemployment Among Ages 30 to 34 years Correlation Summary
| Measurement | Dutch West Indian | Immigrants from Lithuania |
| Minimum | 5.7% | 1.2% |
| Maximum | 100.0% | 13.1% |
| Range | 94.3% | 11.9% |
| Mean | 22.0% | 5.8% |
| Median | 13.2% | 4.9% |
| Interquartile 25% (IQ1) | 8.7% | 4.1% |
| Interquartile 75% (IQ3) | 28.9% | 6.9% |
| Interquartile Range (IQR) | 20.3% | 2.8% |
| Standard Deviation (Sample) | 24.0% | 3.0% |
| Standard Deviation (Population) | 23.2% | 2.9% |
Similar Demographics by Unemployment Among Ages 30 to 34 years
Demographics Similar to Dutch West Indians by Unemployment Among Ages 30 to 34 years
In terms of unemployment among ages 30 to 34 years, the demographic groups most similar to Dutch West Indians are Bahamian (6.6%, a difference of 0.050%), Immigrants from Barbados (6.6%, a difference of 0.10%), Belizean (6.6%, a difference of 0.34%), Creek (6.6%, a difference of 0.35%), and Immigrants from Jamaica (6.5%, a difference of 0.45%).
| Demographics | Rating | Rank | Unemployment Among Ages 30 to 34 years |
| Vietnamese | 0.0 /100 | #292 | Tragic 6.5% |
| West Indians | 0.0 /100 | #293 | Tragic 6.5% |
| Barbadians | 0.0 /100 | #294 | Tragic 6.5% |
| Trinidadians and Tobagonians | 0.0 /100 | #295 | Tragic 6.5% |
| Immigrants | Jamaica | 0.0 /100 | #296 | Tragic 6.5% |
| Creek | 0.0 /100 | #297 | Tragic 6.6% |
| Immigrants | Barbados | 0.0 /100 | #298 | Tragic 6.6% |
| Dutch West Indians | 0.0 /100 | #299 | Tragic 6.6% |
| Bahamians | 0.0 /100 | #300 | Tragic 6.6% |
| Belizeans | 0.0 /100 | #301 | Tragic 6.6% |
| Delaware | 0.0 /100 | #302 | Tragic 6.7% |
| Cajuns | 0.0 /100 | #303 | Tragic 6.7% |
| Kiowa | 0.0 /100 | #304 | Tragic 6.7% |
| Paiute | 0.0 /100 | #305 | Tragic 6.7% |
| Immigrants | Armenia | 0.0 /100 | #306 | Tragic 6.8% |
Demographics Similar to Immigrants from Lithuania by Unemployment Among Ages 30 to 34 years
In terms of unemployment among ages 30 to 34 years, the demographic groups most similar to Immigrants from Lithuania are Indonesian (5.2%, a difference of 0.050%), Immigrants from Indonesia (5.2%, a difference of 0.10%), Uruguayan (5.2%, a difference of 0.17%), Chilean (5.2%, a difference of 0.21%), and Scandinavian (5.2%, a difference of 0.25%).
| Demographics | Rating | Rank | Unemployment Among Ages 30 to 34 years |
| Immigrants | Moldova | 96.4 /100 | #72 | Exceptional 5.1% |
| Slovenes | 96.2 /100 | #73 | Exceptional 5.2% |
| Immigrants | Asia | 96.2 /100 | #74 | Exceptional 5.2% |
| Iranians | 96.0 /100 | #75 | Exceptional 5.2% |
| Scandinavians | 95.6 /100 | #76 | Exceptional 5.2% |
| Uruguayans | 95.4 /100 | #77 | Exceptional 5.2% |
| Indonesians | 95.1 /100 | #78 | Exceptional 5.2% |
| Immigrants | Lithuania | 95.0 /100 | #79 | Exceptional 5.2% |
| Immigrants | Indonesia | 94.7 /100 | #80 | Exceptional 5.2% |
| Chileans | 94.4 /100 | #81 | Exceptional 5.2% |
| Immigrants | Latvia | 94.2 /100 | #82 | Exceptional 5.2% |
| Immigrants | Korea | 94.1 /100 | #83 | Exceptional 5.2% |
| Immigrants | Uganda | 94.0 /100 | #84 | Exceptional 5.2% |
| Immigrants | Egypt | 93.9 /100 | #85 | Exceptional 5.2% |
| Immigrants | Australia | 93.5 /100 | #86 | Exceptional 5.2% |