Dutch vs French Canadian Unemployment Among Ages 60 to 64 years
COMPARE
Dutch
French Canadian
Unemployment Among Ages 60 to 64 years
Unemployment Among Ages 60 to 64 years Comparison
Dutch
French Canadians
4.6%
UNEMPLOYMENT AMONG AGES 60 TO 64 YEARS
99.9/ 100
METRIC RATING
54th/ 347
METRIC RANK
4.8%
UNEMPLOYMENT AMONG AGES 60 TO 64 YEARS
87.6/ 100
METRIC RATING
136th/ 347
METRIC RANK
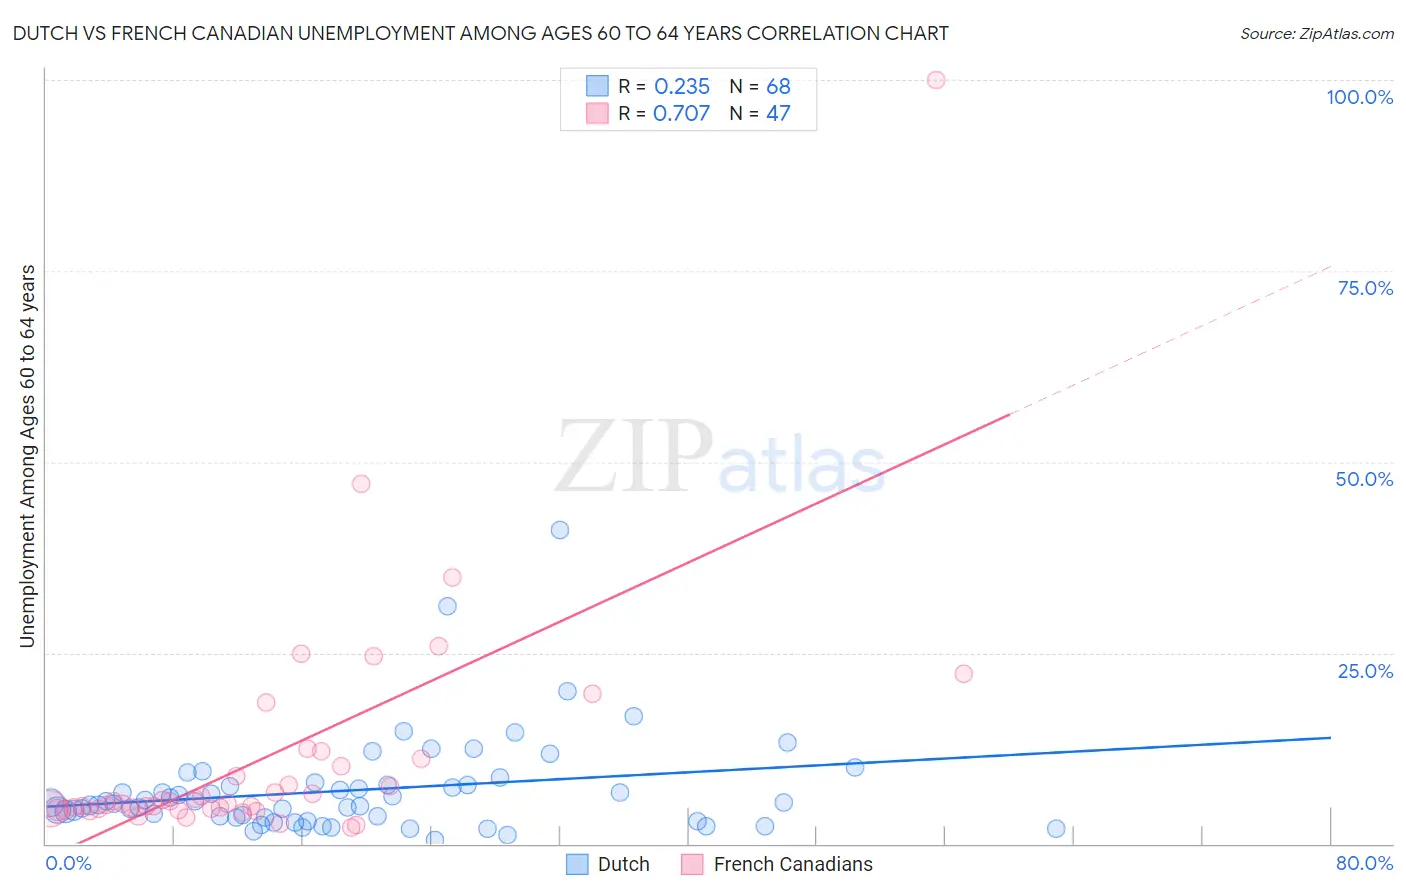
Dutch vs French Canadian Unemployment Among Ages 60 to 64 years Correlation Chart
The statistical analysis conducted on geographies consisting of 455,914,011 people shows a weak positive correlation between the proportion of Dutch and unemployment rate among population between the ages 60 and 64 in the United States with a correlation coefficient (R) of 0.235 and weighted average of 4.6%. Similarly, the statistical analysis conducted on geographies consisting of 428,566,208 people shows a strong positive correlation between the proportion of French Canadians and unemployment rate among population between the ages 60 and 64 in the United States with a correlation coefficient (R) of 0.707 and weighted average of 4.8%, a difference of 4.4%.
Unemployment Among Ages 60 to 64 years Correlation Summary
| Measurement | Dutch | French Canadian |
| Minimum | 0.50% | 2.1% |
| Maximum | 41.1% | 100.0% |
| Range | 40.6% | 97.9% |
| Mean | 7.0% | 11.3% |
| Median | 5.3% | 5.3% |
| Interquartile 25% (IQ1) | 3.5% | 4.5% |
| Interquartile 75% (IQ3) | 7.7% | 11.1% |
| Interquartile Range (IQR) | 4.3% | 6.6% |
| Standard Deviation (Sample) | 6.5% | 16.1% |
| Standard Deviation (Population) | 6.5% | 15.9% |
Similar Demographics by Unemployment Among Ages 60 to 64 years
Demographics Similar to Dutch by Unemployment Among Ages 60 to 64 years
In terms of unemployment among ages 60 to 64 years, the demographic groups most similar to Dutch are Bangladeshi (4.6%, a difference of 0.020%), Immigrants from Moldova (4.6%, a difference of 0.030%), Welsh (4.6%, a difference of 0.11%), British (4.6%, a difference of 0.12%), and Kenyan (4.6%, a difference of 0.14%).
| Demographics | Rating | Rank | Unemployment Among Ages 60 to 64 years |
| Assyrians/Chaldeans/Syriacs | 99.9 /100 | #47 | Exceptional 4.5% |
| Immigrants | Zimbabwe | 99.9 /100 | #48 | Exceptional 4.6% |
| Scotch-Irish | 99.9 /100 | #49 | Exceptional 4.6% |
| Scottish | 99.9 /100 | #50 | Exceptional 4.6% |
| Immigrants | Kenya | 99.9 /100 | #51 | Exceptional 4.6% |
| Kenyans | 99.9 /100 | #52 | Exceptional 4.6% |
| Immigrants | Moldova | 99.9 /100 | #53 | Exceptional 4.6% |
| Dutch | 99.9 /100 | #54 | Exceptional 4.6% |
| Bangladeshis | 99.9 /100 | #55 | Exceptional 4.6% |
| Welsh | 99.9 /100 | #56 | Exceptional 4.6% |
| British | 99.9 /100 | #57 | Exceptional 4.6% |
| Immigrants | India | 99.8 /100 | #58 | Exceptional 4.6% |
| Swiss | 99.8 /100 | #59 | Exceptional 4.6% |
| Puget Sound Salish | 99.8 /100 | #60 | Exceptional 4.6% |
| Lebanese | 99.8 /100 | #61 | Exceptional 4.6% |
Demographics Similar to French Canadians by Unemployment Among Ages 60 to 64 years
In terms of unemployment among ages 60 to 64 years, the demographic groups most similar to French Canadians are Pennsylvania German (4.8%, a difference of 0.010%), Cambodian (4.8%, a difference of 0.050%), Immigrants from Lithuania (4.8%, a difference of 0.080%), Immigrants from Africa (4.8%, a difference of 0.080%), and Basque (4.8%, a difference of 0.10%).
| Demographics | Rating | Rank | Unemployment Among Ages 60 to 64 years |
| Immigrants | Serbia | 90.2 /100 | #129 | Exceptional 4.8% |
| Immigrants | Syria | 90.1 /100 | #130 | Exceptional 4.8% |
| Immigrants | Lebanon | 89.6 /100 | #131 | Excellent 4.8% |
| Lithuanians | 89.6 /100 | #132 | Excellent 4.8% |
| Yaqui | 89.5 /100 | #133 | Excellent 4.8% |
| Basques | 88.8 /100 | #134 | Excellent 4.8% |
| Pennsylvania Germans | 87.8 /100 | #135 | Excellent 4.8% |
| French Canadians | 87.6 /100 | #136 | Excellent 4.8% |
| Cambodians | 86.9 /100 | #137 | Excellent 4.8% |
| Immigrants | Lithuania | 86.7 /100 | #138 | Excellent 4.8% |
| Immigrants | Africa | 86.6 /100 | #139 | Excellent 4.8% |
| Pima | 85.8 /100 | #140 | Excellent 4.8% |
| Panamanians | 85.5 /100 | #141 | Excellent 4.8% |
| Immigrants | Ethiopia | 85.3 /100 | #142 | Excellent 4.8% |
| Italians | 85.0 /100 | #143 | Excellent 4.8% |