Dominican vs Cape Verdean Unemployment Among Youth under 25 years

COMPARE

Dominican
Race
Ancestry
AfghanAfricanAlaska NativeAlaskan AthabascanAlbanianAleutAlsatianAmericanApacheArabArapahoArgentineanArmenianAssyrian/Chaldean/SyriacAustralianAustrianBahamianBangladeshiBarbadianBasqueBelgianBelizeanBermudanBhutaneseBlackfeetBolivianBrazilianBritishBritish West IndianBulgarianBurmeseCajunCambodianCanadianCarpatho RusynCelticCentral AmericanCentral American IndianCherokeeCheyenneChickasawChileanChineseChippewaChoctawColombianColvilleComancheCosta RicanCreeCreekCroatianCrowCubanCypriotCzechCzechoslovakianDanishDelawareDominicanDutchDutch West IndianEastern EuropeanEcuadorianEgyptianEnglishEstonianEthiopianEuropeanFijianFilipinoFinnishFrenchFrench American IndianFrench CanadianGermanGerman RussianGhanaianGreekGuamanian/ChamorroGuatemalanGuyaneseHaitianHmongHonduranHopiHoumaHungarianIcelanderIndian (Asian)IndonesianInupiatIranianIraqiIrishIroquoisIsraeliItalianJamaicanJapaneseJordanianKenyanKiowaKoreanLaotianLatvianLebaneseLiberianLithuanianLumbeeLuxembourgerMacedonianMalaysianMalteseMarshalleseMenomineeMexicanMexican American IndianMongolianMoroccanNative HawaiianNavajoNepaleseNew ZealanderNicaraguanNigerianNorthern EuropeanNorwegianOkinawanOsageOttawaPaiutePakistaniPalestinianPanamanianParaguayanPennsylvania GermanPeruvianPimaPolishPortuguesePotawatomiPuebloPuerto RicanPuget Sound SalishRomanianRussianSalvadoranSamoanScandinavianScotch-IrishScottishSeminoleSenegaleseSerbianShoshoneSierra LeoneanSiouxSlavicSlovakSloveneSomaliSouth AfricanSouth AmericanSouth American IndianSoviet UnionSpaniardSpanishSpanish AmericanSpanish American IndianSri LankanSubsaharan AfricanSudaneseSwedishSwissSyrianTaiwaneseThaiTlingit-HaidaTohono O'OdhamTonganTrinidadian and TobagonianTsimshianTurkishU.S. Virgin IslanderUgandanUkrainianUruguayanUteVenezuelanVietnameseWelshWest IndianYakamaYaquiYugoslavianYumanYup'ikZimbabwean
Immigration
NonimmigrantsImmigrantsAfghanistanAfricaAlbaniaArgentinaArmeniaAsiaAustraliaAustriaBahamasBangladeshBarbadosBelarusBelgiumBelizeBoliviaBosnia and HerzegovinaBrazilBulgariaBurma/MyanmarCabo VerdeCambodiaCameroonCanadaCaribbeanCentral AmericaChileChinaColombiaCongoCosta RicaCroatiaCubaCzechoslovakiaDenmarkDominicaDominican RepublicEastern AfricaEastern AsiaEastern EuropeEcuadorEgyptEl SalvadorEnglandEritreaEthiopiaEuropeFijiFranceGermanyGhanaGreeceGrenadaGuatemalaGuyanaHaitiHondurasHong KongHungaryIndiaIndonesiaIranIraqIrelandIsraelItalyJamaicaJapanJordanKazakhstanKenyaKoreaKuwaitLaosLatin AmericaLatviaLebanonLiberiaLithuaniaMalaysiaMexicoMicronesiaMiddle AfricaMoldovaMoroccoNepalNetherlandsNicaraguaNigeriaNorth AmericaNorth MacedoniaNorthern AfricaNorthern EuropeNorwayOceaniaPakistanPanamaPeruPhilippinesPolandPortugalRomaniaRussiaSaudi ArabiaScotlandSenegalSerbiaSierra LeoneSingaporeSomaliaSouth AfricaSouth AmericaSouth Central AsiaSouth Eastern AsiaSouthern EuropeSpainSri LankaSt. Vincent and the GrenadinesSudanSwedenSwitzerlandSyriaTaiwanThailandTrinidad and TobagoTurkeyUgandaUkraineUruguayUzbekistanVenezuelaVietnamWest IndiesWestern AfricaWestern AsiaWestern EuropeYemenZaireZimbabweAzores
Cape Verdean
Race
Ancestry
AfghanAfricanAlaska NativeAlaskan AthabascanAlbanianAleutAlsatianAmericanApacheArabArapahoArgentineanArmenianAssyrian/Chaldean/SyriacAustralianAustrianBahamianBangladeshiBarbadianBasqueBelgianBelizeanBermudanBhutaneseBlackfeetBolivianBrazilianBritishBritish West IndianBulgarianBurmeseCajunCambodianCanadianCape VerdeanCarpatho RusynCelticCentral AmericanCentral American IndianCherokeeCheyenneChickasawChileanChineseChippewaChoctawColombianColvilleComancheCosta RicanCreeCreekCroatianCrowCubanCypriotCzechCzechoslovakianDanishDelawareDutchDutch West IndianEastern EuropeanEcuadorianEgyptianEnglishEstonianEthiopianEuropeanFijianFilipinoFinnishFrenchFrench American IndianFrench CanadianGermanGerman RussianGhanaianGreekGuamanian/ChamorroGuatemalanGuyaneseHaitianHmongHonduranHopiHoumaHungarianIcelanderIndian (Asian)IndonesianInupiatIranianIraqiIrishIroquoisIsraeliItalianJamaicanJapaneseJordanianKenyanKiowaKoreanLaotianLatvianLebaneseLiberianLithuanianLumbeeLuxembourgerMacedonianMalaysianMalteseMarshalleseMenomineeMexicanMexican American IndianMongolianMoroccanNative HawaiianNavajoNepaleseNew ZealanderNicaraguanNigerianNorthern EuropeanNorwegianOkinawanOsageOttawaPaiutePakistaniPalestinianPanamanianParaguayanPennsylvania GermanPeruvianPimaPolishPortuguesePotawatomiPuebloPuerto RicanPuget Sound SalishRomanianRussianSalvadoranSamoanScandinavianScotch-IrishScottishSeminoleSenegaleseSerbianShoshoneSierra LeoneanSiouxSlavicSlovakSloveneSomaliSouth AfricanSouth AmericanSouth American IndianSoviet UnionSpaniardSpanishSpanish AmericanSpanish American IndianSri LankanSubsaharan AfricanSudaneseSwedishSwissSyrianTaiwaneseThaiTlingit-HaidaTohono O'OdhamTonganTrinidadian and TobagonianTsimshianTurkishU.S. Virgin IslanderUgandanUkrainianUruguayanUteVenezuelanVietnameseWelshWest IndianYakamaYaquiYugoslavianYumanYup'ikZimbabwean
Immigration
NonimmigrantsImmigrantsAfghanistanAfricaAlbaniaArgentinaArmeniaAsiaAustraliaAustriaBahamasBangladeshBarbadosBelarusBelgiumBelizeBoliviaBosnia and HerzegovinaBrazilBulgariaBurma/MyanmarCabo VerdeCambodiaCameroonCanadaCaribbeanCentral AmericaChileChinaColombiaCongoCosta RicaCroatiaCubaCzechoslovakiaDenmarkDominicaDominican RepublicEastern AfricaEastern AsiaEastern EuropeEcuadorEgyptEl SalvadorEnglandEritreaEthiopiaEuropeFijiFranceGermanyGhanaGreeceGrenadaGuatemalaGuyanaHaitiHondurasHong KongHungaryIndiaIndonesiaIranIraqIrelandIsraelItalyJamaicaJapanJordanKazakhstanKenyaKoreaKuwaitLaosLatin AmericaLatviaLebanonLiberiaLithuaniaMalaysiaMexicoMicronesiaMiddle AfricaMoldovaMoroccoNepalNetherlandsNicaraguaNigeriaNorth AmericaNorth MacedoniaNorthern AfricaNorthern EuropeNorwayOceaniaPakistanPanamaPeruPhilippinesPolandPortugalRomaniaRussiaSaudi ArabiaScotlandSenegalSerbiaSierra LeoneSingaporeSomaliaSouth AfricaSouth AmericaSouth Central AsiaSouth Eastern AsiaSouthern EuropeSpainSri LankaSt. Vincent and the GrenadinesSudanSwedenSwitzerlandSyriaTaiwanThailandTrinidad and TobagoTurkeyUgandaUkraineUruguayUzbekistanVenezuelaVietnamWest IndiesWestern AfricaWestern AsiaWestern EuropeYemenZaireZimbabweAzores
Unemployment Among Youth under 25 years
Income
Poverty
Unemployment
Labor Participation
Family Structure
Vehicle Availability
Education Level
Disability

Unemployment Among Youth under 25 years Comparison

Dominicans

Cape Verdeans

Tragic
Tragic
15.7%
UNEMPLOYMENT AMONG YOUTH UNDER 25 YEARS
0.0/ 100
METRIC RATING
331st/ 347
METRIC RANK
12.9%
UNEMPLOYMENT AMONG YOUTH UNDER 25 YEARS
0.0/ 100
METRIC RATING
272nd/ 347
METRIC RANK

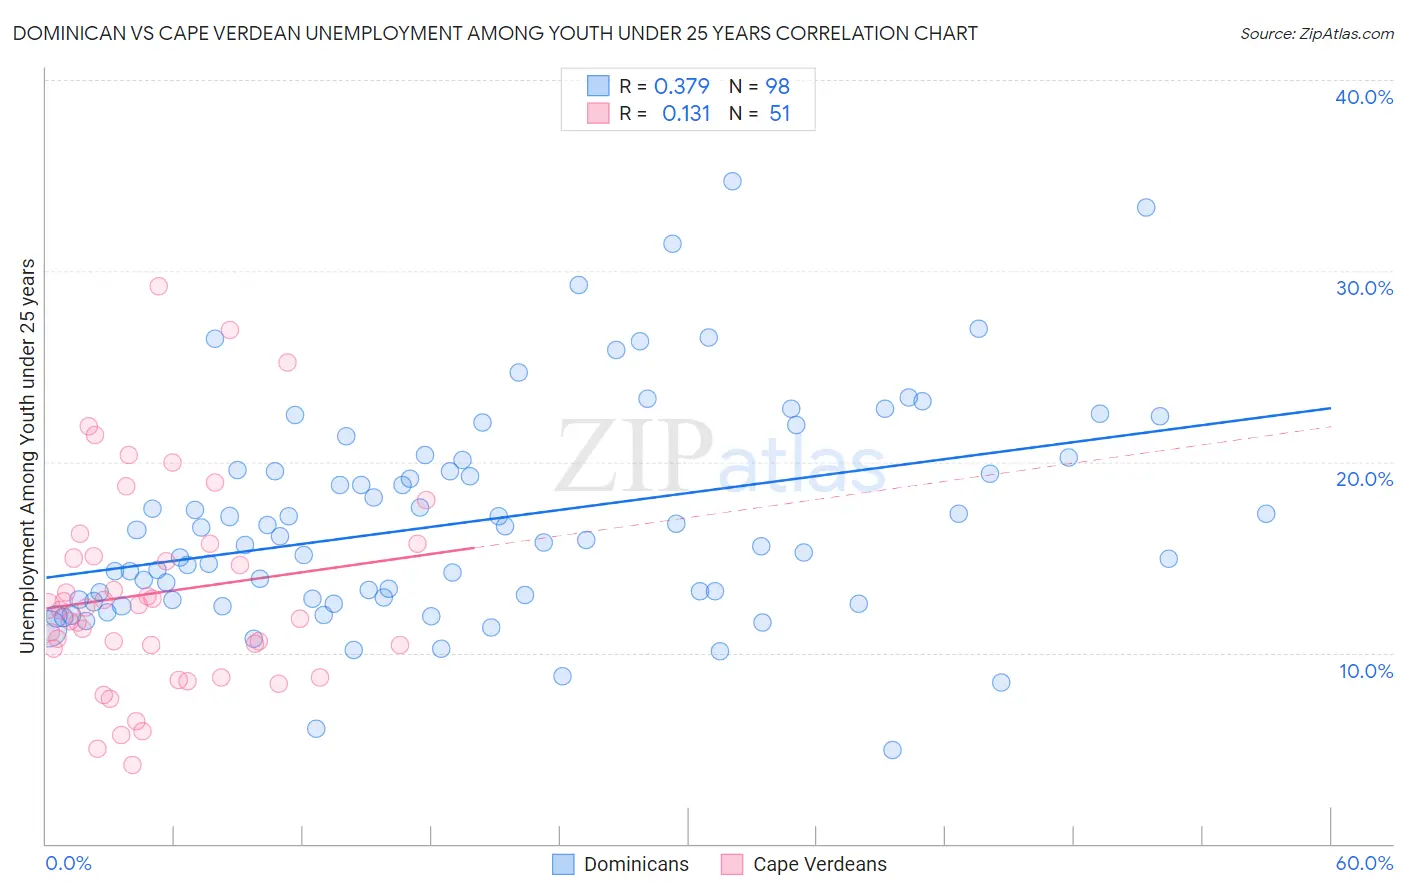
Dominican vs Cape Verdean Unemployment Among Youth under 25 years Correlation Chart

The statistical analysis conducted on geographies consisting of 351,460,468 people shows a mild positive correlation between the proportion of Dominicans and unemployment rate among youth under the age of 25 in the United States with a correlation coefficient (R) of 0.379 and weighted average of 15.7%. Similarly, the statistical analysis conducted on geographies consisting of 107,205,825 people shows a poor positive correlation between the proportion of Cape Verdeans and unemployment rate among youth under the age of 25 in the United States with a correlation coefficient (R) of 0.131 and weighted average of 12.9%, a difference of 21.7%.
Dominican vs Cape Verdean Unemployment Among Youth under 25 years

Unemployment Among Youth under 25 years Correlation Summary

MeasurementDominicanCape Verdean
Minimum4.9%4.1%
Maximum34.7%29.2%
Range29.8%25.1%
Mean16.9%13.2%
Median15.9%12.4%
Interquartile 25% (IQ1)12.8%10.2%
Interquartile 75% (IQ3)19.6%15.7%
Interquartile Range (IQR)6.8%5.5%
Standard Deviation (Sample)5.6%5.5%
Standard Deviation (Population)5.6%5.4%

Similar Demographics by Unemployment Among Youth under 25 years

Demographics Similar to Dominicans by Unemployment Among Youth under 25 years

In terms of unemployment among youth under 25 years, the demographic groups most similar to Dominicans are Immigrants from Grenada (15.8%, a difference of 0.67%), Yakama (15.6%, a difference of 0.83%), Immigrants from Yemen (15.6%, a difference of 0.87%), Immigrants from Dominican Republic (15.6%, a difference of 1.0%), and British West Indian (15.5%, a difference of 1.1%).
DemographicsRating | RankUnemployment Among Youth under 25 years
Immigrants | Jamaica
0.0
/100
|
#324
Tragic
14.8%
Alaska Natives
0.0
/100
|
#325
Tragic
14.9%
Immigrants | Barbados
0.0
/100
|
#326
Tragic
15.2%
British West Indians
0.0
/100
|
#327
Tragic
15.5%
Immigrants | Dominican Republic
0.0
/100
|
#328
Tragic
15.6%
Immigrants | Yemen
0.0
/100
|
#329
Tragic
15.6%
Yakama
0.0
/100
|
#330
Tragic
15.6%
Dominicans
0.0
/100
|
#331
Tragic
15.7%
Immigrants | Grenada
0.0
/100
|
#332
Tragic
15.8%
Guyanese
0.0
/100
|
#333
Tragic
15.9%
Immigrants | Guyana
0.0
/100
|
#334
Tragic
15.9%
Immigrants | St. Vincent and the Grenadines
0.0
/100
|
#335
Tragic
16.1%
Pima
0.0
/100
|
#336
Tragic
16.2%
Arapaho
0.0
/100
|
#337
Tragic
16.3%
Yuman
0.0
/100
|
#338
Tragic
16.3%

Demographics Similar to Cape Verdeans by Unemployment Among Youth under 25 years

In terms of unemployment among youth under 25 years, the demographic groups most similar to Cape Verdeans are Immigrants from Bahamas (12.9%, a difference of 0.22%), Nigerian (13.0%, a difference of 0.35%), Immigrants from Liberia (12.8%, a difference of 0.75%), Immigrants from Nigeria (13.0%, a difference of 0.93%), and Bermudan (13.0%, a difference of 1.0%).
DemographicsRating | RankUnemployment Among Youth under 25 years
Nepalese
0.0
/100
|
#265
Tragic
12.5%
Immigrants | Latin America
0.0
/100
|
#266
Tragic
12.6%
Sub-Saharan Africans
0.0
/100
|
#267
Tragic
12.6%
Tlingit-Haida
0.0
/100
|
#268
Tragic
12.7%
Kiowa
0.0
/100
|
#269
Tragic
12.7%
Immigrants | Liberia
0.0
/100
|
#270
Tragic
12.8%
Immigrants | Bahamas
0.0
/100
|
#271
Tragic
12.9%
Cape Verdeans
0.0
/100
|
#272
Tragic
12.9%
Nigerians
0.0
/100
|
#273
Tragic
13.0%
Immigrants | Nigeria
0.0
/100
|
#274
Tragic
13.0%
Bermudans
0.0
/100
|
#275
Tragic
13.0%
Immigrants | Uzbekistan
0.0
/100
|
#276
Tragic
13.1%
Bahamians
0.0
/100
|
#277
Tragic
13.1%
Africans
0.0
/100
|
#278
Tragic
13.2%
Cajuns
0.0
/100
|
#279
Tragic
13.2%