Delaware vs Immigrants from Bangladesh Unemployment Among Ages 20 to 24 years
COMPARE
Delaware
Immigrants from Bangladesh
Unemployment Among Ages 20 to 24 years
Unemployment Among Ages 20 to 24 years Comparison
Delaware
Immigrants from Bangladesh
11.3%
UNEMPLOYMENT AMONG AGES 20 TO 24 YEARS
0.0/ 100
METRIC RATING
270th/ 347
METRIC RANK
12.6%
UNEMPLOYMENT AMONG AGES 20 TO 24 YEARS
0.0/ 100
METRIC RATING
309th/ 347
METRIC RANK
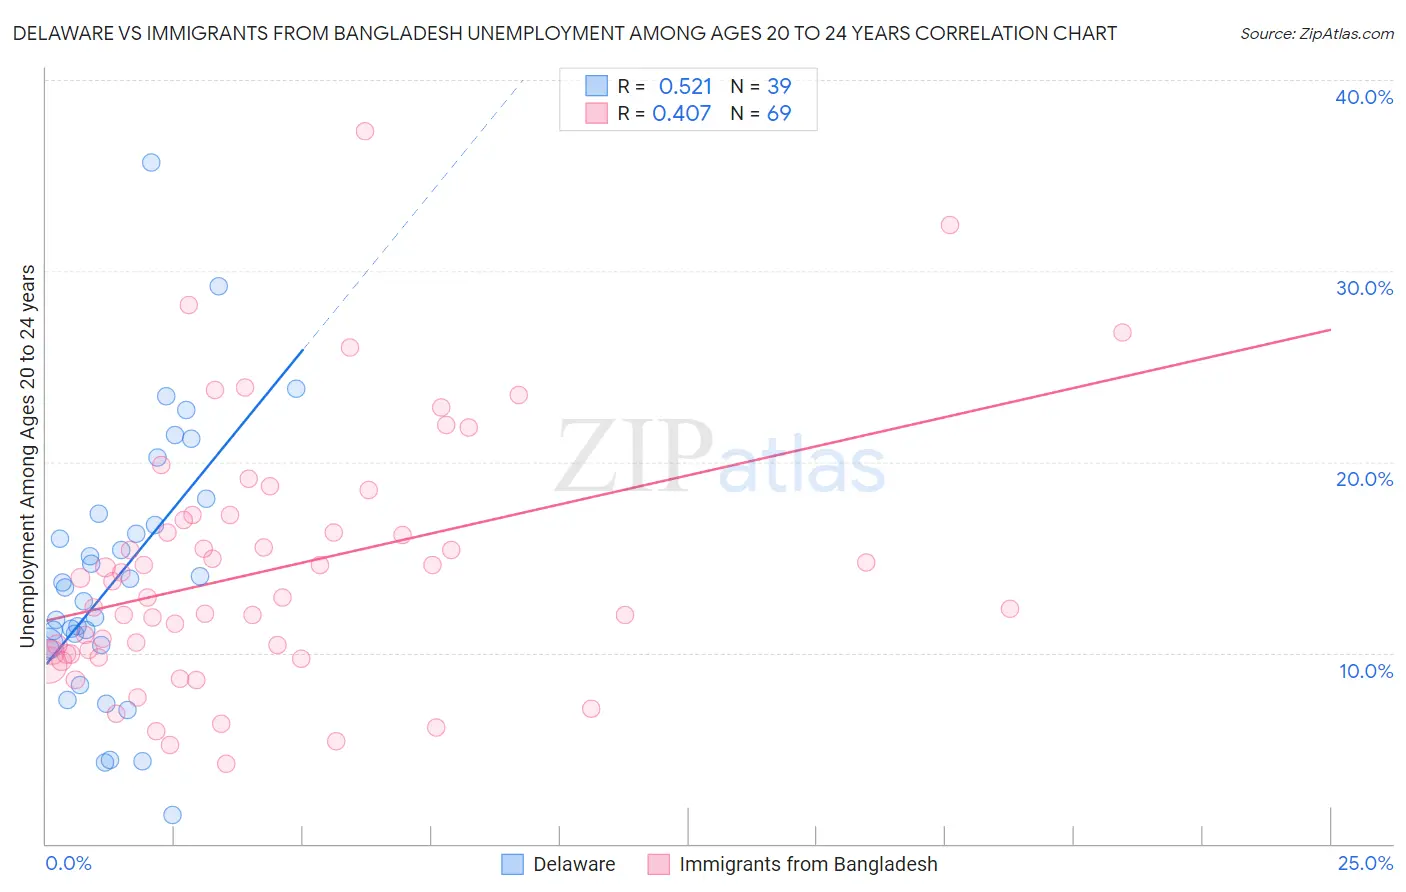
Delaware vs Immigrants from Bangladesh Unemployment Among Ages 20 to 24 years Correlation Chart
The statistical analysis conducted on geographies consisting of 94,864,016 people shows a substantial positive correlation between the proportion of Delaware and unemployment rate among population between the ages 20 and 24 in the United States with a correlation coefficient (R) of 0.521 and weighted average of 11.3%. Similarly, the statistical analysis conducted on geographies consisting of 201,651,258 people shows a moderate positive correlation between the proportion of Immigrants from Bangladesh and unemployment rate among population between the ages 20 and 24 in the United States with a correlation coefficient (R) of 0.407 and weighted average of 12.6%, a difference of 11.3%.
Unemployment Among Ages 20 to 24 years Correlation Summary
| Measurement | Delaware | Immigrants from Bangladesh |
| Minimum | 1.5% | 4.2% |
| Maximum | 35.7% | 37.3% |
| Range | 34.2% | 33.1% |
| Mean | 14.1% | 14.3% |
| Median | 13.4% | 12.9% |
| Interquartile 25% (IQ1) | 10.4% | 10.0% |
| Interquartile 75% (IQ3) | 17.3% | 17.1% |
| Interquartile Range (IQR) | 6.8% | 7.1% |
| Standard Deviation (Sample) | 7.0% | 6.6% |
| Standard Deviation (Population) | 6.9% | 6.5% |
Similar Demographics by Unemployment Among Ages 20 to 24 years
Demographics Similar to Delaware by Unemployment Among Ages 20 to 24 years
In terms of unemployment among ages 20 to 24 years, the demographic groups most similar to Delaware are Ute (11.2%, a difference of 0.58%), Maltese (11.2%, a difference of 0.97%), Immigrants from Uzbekistan (11.4%, a difference of 1.1%), Nigerian (11.4%, a difference of 1.1%), and Immigrants from Greece (11.1%, a difference of 1.4%).
| Demographics | Rating | Rank | Unemployment Among Ages 20 to 24 years |
| Marshallese | 0.1 /100 | #263 | Tragic 11.0% |
| Sub-Saharan Africans | 0.0 /100 | #264 | Tragic 11.1% |
| Immigrants | Ireland | 0.0 /100 | #265 | Tragic 11.1% |
| Immigrants | Liberia | 0.0 /100 | #266 | Tragic 11.1% |
| Immigrants | Greece | 0.0 /100 | #267 | Tragic 11.1% |
| Maltese | 0.0 /100 | #268 | Tragic 11.2% |
| Ute | 0.0 /100 | #269 | Tragic 11.2% |
| Delaware | 0.0 /100 | #270 | Tragic 11.3% |
| Immigrants | Uzbekistan | 0.0 /100 | #271 | Tragic 11.4% |
| Nigerians | 0.0 /100 | #272 | Tragic 11.4% |
| Immigrants | Nigeria | 0.0 /100 | #273 | Tragic 11.5% |
| Cape Verdeans | 0.0 /100 | #274 | Tragic 11.5% |
| Senegalese | 0.0 /100 | #275 | Tragic 11.5% |
| Sierra Leoneans | 0.0 /100 | #276 | Tragic 11.5% |
| Africans | 0.0 /100 | #277 | Tragic 11.5% |
Demographics Similar to Immigrants from Bangladesh by Unemployment Among Ages 20 to 24 years
In terms of unemployment among ages 20 to 24 years, the demographic groups most similar to Immigrants from Bangladesh are Tohono O'odham (12.5%, a difference of 0.080%), Jamaican (12.6%, a difference of 0.12%), Vietnamese (12.6%, a difference of 0.57%), Houma (12.6%, a difference of 0.72%), and Bermudan (12.5%, a difference of 0.76%).
| Demographics | Rating | Rank | Unemployment Among Ages 20 to 24 years |
| Immigrants | Cabo Verde | 0.0 /100 | #302 | Tragic 12.2% |
| Haitians | 0.0 /100 | #303 | Tragic 12.2% |
| Immigrants | West Indies | 0.0 /100 | #304 | Tragic 12.3% |
| Chippewa | 0.0 /100 | #305 | Tragic 12.3% |
| Immigrants | Haiti | 0.0 /100 | #306 | Tragic 12.4% |
| Bermudans | 0.0 /100 | #307 | Tragic 12.5% |
| Tohono O'odham | 0.0 /100 | #308 | Tragic 12.5% |
| Immigrants | Bangladesh | 0.0 /100 | #309 | Tragic 12.6% |
| Jamaicans | 0.0 /100 | #310 | Tragic 12.6% |
| Vietnamese | 0.0 /100 | #311 | Tragic 12.6% |
| Houma | 0.0 /100 | #312 | Tragic 12.6% |
| Shoshone | 0.0 /100 | #313 | Tragic 12.7% |
| Blacks/African Americans | 0.0 /100 | #314 | Tragic 12.7% |
| West Indians | 0.0 /100 | #315 | Tragic 12.8% |
| Immigrants | Dominica | 0.0 /100 | #316 | Tragic 12.8% |