Danish vs Immigrants from El Salvador Unemployment Among Ages 55 to 59 years
COMPARE
Danish
Immigrants from El Salvador
Unemployment Among Ages 55 to 59 years
Unemployment Among Ages 55 to 59 years Comparison
Danes
Immigrants from El Salvador
4.3%
UNEMPLOYMENT AMONG AGES 55 TO 59 YEARS
100.0/ 100
METRIC RATING
12th/ 347
METRIC RANK
5.1%
UNEMPLOYMENT AMONG AGES 55 TO 59 YEARS
0.1/ 100
METRIC RATING
262nd/ 347
METRIC RANK
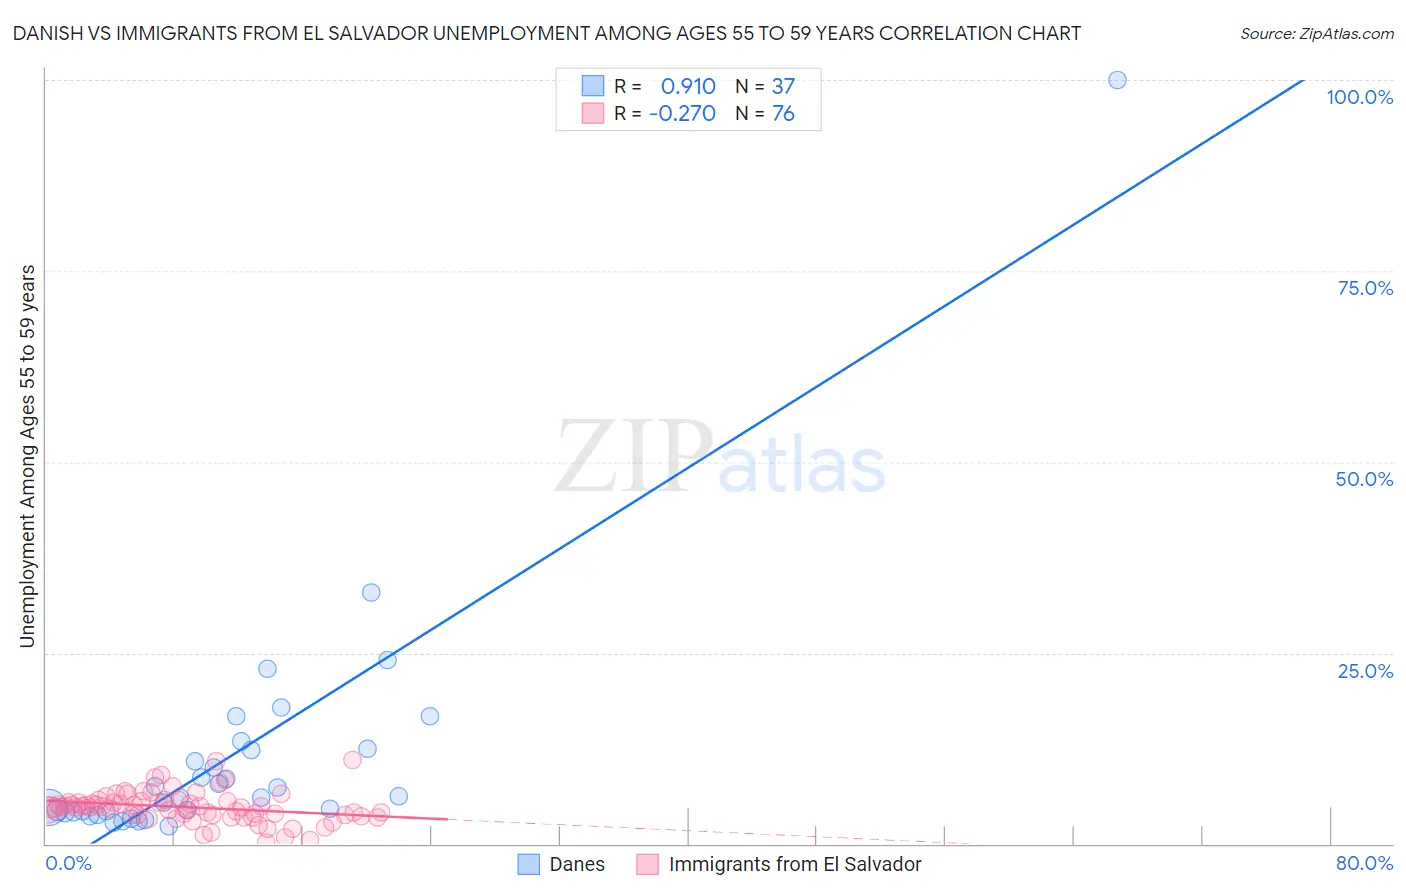
Danish vs Immigrants from El Salvador Unemployment Among Ages 55 to 59 years Correlation Chart
The statistical analysis conducted on geographies consisting of 423,750,471 people shows a near-perfect positive correlation between the proportion of Danes and unemployment rate among population between the ages 55 and 59 in the United States with a correlation coefficient (R) of 0.910 and weighted average of 4.3%. Similarly, the statistical analysis conducted on geographies consisting of 336,036,102 people shows a weak negative correlation between the proportion of Immigrants from El Salvador and unemployment rate among population between the ages 55 and 59 in the United States with a correlation coefficient (R) of -0.270 and weighted average of 5.1%, a difference of 19.3%.
Unemployment Among Ages 55 to 59 years Correlation Summary
| Measurement | Danish | Immigrants from El Salvador |
| Minimum | 2.4% | 0.10% |
| Maximum | 100.0% | 11.0% |
| Range | 97.6% | 10.9% |
| Mean | 11.2% | 4.8% |
| Median | 6.1% | 4.8% |
| Interquartile 25% (IQ1) | 4.1% | 3.8% |
| Interquartile 75% (IQ3) | 12.4% | 5.5% |
| Interquartile Range (IQR) | 8.3% | 1.7% |
| Standard Deviation (Sample) | 16.5% | 2.0% |
| Standard Deviation (Population) | 16.3% | 2.0% |
Similar Demographics by Unemployment Among Ages 55 to 59 years
Demographics Similar to Danes by Unemployment Among Ages 55 to 59 years
In terms of unemployment among ages 55 to 59 years, the demographic groups most similar to Danes are Immigrants from Congo (4.3%, a difference of 0.19%), Indonesian (4.3%, a difference of 0.26%), Immigrants from India (4.3%, a difference of 0.41%), Bulgarian (4.3%, a difference of 0.67%), and Tongan (4.3%, a difference of 0.71%).
| Demographics | Rating | Rank | Unemployment Among Ages 55 to 59 years |
| Immigrants | Bolivia | 100.0 /100 | #5 | Exceptional 4.2% |
| Norwegians | 100.0 /100 | #6 | Exceptional 4.2% |
| Zimbabweans | 100.0 /100 | #7 | Exceptional 4.2% |
| Bolivians | 100.0 /100 | #8 | Exceptional 4.2% |
| Cubans | 100.0 /100 | #9 | Exceptional 4.2% |
| Tongans | 100.0 /100 | #10 | Exceptional 4.3% |
| Immigrants | Congo | 100.0 /100 | #11 | Exceptional 4.3% |
| Danes | 100.0 /100 | #12 | Exceptional 4.3% |
| Indonesians | 100.0 /100 | #13 | Exceptional 4.3% |
| Immigrants | India | 100.0 /100 | #14 | Exceptional 4.3% |
| Bulgarians | 100.0 /100 | #15 | Exceptional 4.3% |
| Somalis | 100.0 /100 | #16 | Exceptional 4.4% |
| Czechs | 100.0 /100 | #17 | Exceptional 4.4% |
| Immigrants | Somalia | 100.0 /100 | #18 | Exceptional 4.4% |
| Chinese | 100.0 /100 | #19 | Exceptional 4.4% |
Demographics Similar to Immigrants from El Salvador by Unemployment Among Ages 55 to 59 years
In terms of unemployment among ages 55 to 59 years, the demographic groups most similar to Immigrants from El Salvador are African (5.1%, a difference of 0.070%), Immigrants from Western Africa (5.1%, a difference of 0.17%), Immigrants from Sierra Leone (5.2%, a difference of 0.19%), Immigrants from West Indies (5.1%, a difference of 0.28%), and Immigrants from Caribbean (5.2%, a difference of 0.29%).
| Demographics | Rating | Rank | Unemployment Among Ages 55 to 59 years |
| Blackfeet | 0.3 /100 | #255 | Tragic 5.1% |
| Senegalese | 0.3 /100 | #256 | Tragic 5.1% |
| Central Americans | 0.2 /100 | #257 | Tragic 5.1% |
| Salvadorans | 0.2 /100 | #258 | Tragic 5.1% |
| Immigrants | West Indies | 0.2 /100 | #259 | Tragic 5.1% |
| Immigrants | Western Africa | 0.2 /100 | #260 | Tragic 5.1% |
| Africans | 0.1 /100 | #261 | Tragic 5.1% |
| Immigrants | El Salvador | 0.1 /100 | #262 | Tragic 5.1% |
| Immigrants | Sierra Leone | 0.1 /100 | #263 | Tragic 5.2% |
| Immigrants | Caribbean | 0.1 /100 | #264 | Tragic 5.2% |
| Yaqui | 0.1 /100 | #265 | Tragic 5.2% |
| Jamaicans | 0.1 /100 | #266 | Tragic 5.2% |
| Immigrants | Senegal | 0.1 /100 | #267 | Tragic 5.2% |
| Mexicans | 0.1 /100 | #268 | Tragic 5.2% |
| Tsimshian | 0.1 /100 | #269 | Tragic 5.2% |