Cypriot vs Immigrants from Germany Unemployment Among Seniors over 75 years

COMPARE

Cypriot
Race
Ancestry
AfghanAfricanAlaska NativeAlaskan AthabascanAlbanianAleutAlsatianAmericanApacheArabArapahoArgentineanArmenianAssyrian/Chaldean/SyriacAustralianAustrianBahamianBangladeshiBarbadianBasqueBelgianBelizeanBermudanBhutaneseBlackfeetBolivianBrazilianBritishBritish West IndianBulgarianBurmeseCajunCambodianCanadianCape VerdeanCarpatho RusynCelticCentral AmericanCentral American IndianCherokeeCheyenneChickasawChileanChineseChippewaChoctawColombianColvilleComancheCosta RicanCreeCreekCroatianCrowCubanCypriotCzechCzechoslovakianDanishDelawareDominicanDutchDutch West IndianEastern EuropeanEcuadorianEgyptianEnglishEstonianEthiopianEuropeanFijianFilipinoFinnishFrenchFrench American IndianFrench CanadianGermanGerman RussianGhanaianGreekGuamanian/ChamorroGuatemalanGuyaneseHaitianHmongHonduranHopiHoumaHungarianIcelanderIndian (Asian)IndonesianInupiatIranianIraqiIrishIroquoisIsraeliItalianJamaicanJapaneseJordanianKenyanKiowaKoreanLaotianLatvianLebaneseLiberianLithuanianLumbeeLuxembourgerMacedonianMalaysianMalteseMarshalleseMexicanMexican American IndianMongolianMoroccanNative HawaiianNavajoNepaleseNew ZealanderNicaraguanNigerianNorthern EuropeanNorwegianOkinawanOsageOttawaPaiutePakistaniPalestinianPanamanianParaguayanPennsylvania GermanPeruvianPimaPolishPortuguesePotawatomiPuebloPuerto RicanPuget Sound SalishRomanianRussianSalvadoranSamoanScandinavianScotch-IrishScottishSeminoleSenegaleseSerbianShoshoneSierra LeoneanSiouxSlavicSlovakSloveneSomaliSouth AfricanSouth AmericanSouth American IndianSoviet UnionSpaniardSpanishSpanish AmericanSpanish American IndianSri LankanSubsaharan AfricanSudaneseSwedishSwissSyrianTaiwaneseThaiTlingit-HaidaTohono O'OdhamTonganTrinidadian and TobagonianTsimshianTurkishU.S. Virgin IslanderUgandanUkrainianUruguayanUteVenezuelanVietnameseWelshWest IndianYakamaYaquiYugoslavianYumanYup'ikZimbabwean
Immigration
NonimmigrantsImmigrantsAfghanistanAfricaAlbaniaArgentinaArmeniaAsiaAustraliaAustriaBahamasBangladeshBarbadosBelarusBelgiumBelizeBoliviaBosnia and HerzegovinaBrazilBulgariaBurma/MyanmarCabo VerdeCambodiaCameroonCanadaCaribbeanCentral AmericaChileChinaColombiaCongoCosta RicaCroatiaCubaCzechoslovakiaDenmarkDominicaDominican RepublicEastern AfricaEastern AsiaEastern EuropeEcuadorEgyptEl SalvadorEnglandEritreaEthiopiaEuropeFijiFranceGhanaGreeceGrenadaGuatemalaGuyanaHaitiHondurasHong KongHungaryIndiaIndonesiaIranIraqIrelandIsraelItalyJamaicaJapanJordanKazakhstanKenyaKoreaKuwaitLaosLatin AmericaLatviaLebanonLiberiaLithuaniaMalaysiaMexicoMicronesiaMiddle AfricaMoldovaMoroccoNepalNetherlandsNicaraguaNigeriaNorth AmericaNorth MacedoniaNorthern AfricaNorthern EuropeNorwayOceaniaPakistanPanamaPeruPhilippinesPolandPortugalRomaniaRussiaSaudi ArabiaScotlandSenegalSerbiaSierra LeoneSingaporeSomaliaSouth AfricaSouth AmericaSouth Central AsiaSouth Eastern AsiaSouthern EuropeSpainSri LankaSt. Vincent and the GrenadinesSudanSwedenSwitzerlandSyriaTaiwanThailandTrinidad and TobagoTurkeyUgandaUkraineUruguayUzbekistanVenezuelaVietnamWest IndiesWestern AfricaWestern AsiaWestern EuropeYemenZaireZimbabweAzores
Immigrants from Germany
Race
Ancestry
AfghanAfricanAlaska NativeAlaskan AthabascanAlbanianAleutAlsatianAmericanApacheArabArapahoArgentineanArmenianAssyrian/Chaldean/SyriacAustralianAustrianBahamianBangladeshiBarbadianBasqueBelgianBelizeanBermudanBhutaneseBlackfeetBolivianBrazilianBritishBritish West IndianBulgarianBurmeseCajunCambodianCanadianCape VerdeanCarpatho RusynCelticCentral AmericanCentral American IndianCherokeeCheyenneChickasawChileanChineseChippewaChoctawColombianColvilleComancheCosta RicanCreeCreekCroatianCrowCubanCzechCzechoslovakianDanishDelawareDominicanDutchDutch West IndianEastern EuropeanEcuadorianEgyptianEnglishEstonianEthiopianEuropeanFijianFilipinoFinnishFrenchFrench American IndianFrench CanadianGermanGerman RussianGhanaianGreekGuamanian/ChamorroGuatemalanGuyaneseHaitianHmongHonduranHopiHoumaHungarianIcelanderIndian (Asian)IndonesianInupiatIranianIraqiIrishIroquoisIsraeliItalianJamaicanJapaneseJordanianKenyanKiowaKoreanLaotianLatvianLebaneseLiberianLithuanianLumbeeLuxembourgerMacedonianMalaysianMalteseMarshalleseMexicanMexican American IndianMongolianMoroccanNative HawaiianNavajoNepaleseNew ZealanderNicaraguanNigerianNorthern EuropeanNorwegianOkinawanOsageOttawaPaiutePakistaniPalestinianPanamanianParaguayanPennsylvania GermanPeruvianPimaPolishPortuguesePotawatomiPuebloPuerto RicanPuget Sound SalishRomanianRussianSalvadoranSamoanScandinavianScotch-IrishScottishSeminoleSenegaleseSerbianShoshoneSierra LeoneanSiouxSlavicSlovakSloveneSomaliSouth AfricanSouth AmericanSouth American IndianSoviet UnionSpaniardSpanishSpanish AmericanSpanish American IndianSri LankanSubsaharan AfricanSudaneseSwedishSwissSyrianTaiwaneseThaiTlingit-HaidaTohono O'OdhamTonganTrinidadian and TobagonianTsimshianTurkishU.S. Virgin IslanderUgandanUkrainianUruguayanUteVenezuelanVietnameseWelshWest IndianYakamaYaquiYugoslavianYumanYup'ikZimbabwean
Immigration
NonimmigrantsImmigrantsAfghanistanAfricaAlbaniaArgentinaArmeniaAsiaAustraliaAustriaBahamasBangladeshBarbadosBelarusBelgiumBelizeBoliviaBosnia and HerzegovinaBrazilBulgariaBurma/MyanmarCabo VerdeCambodiaCameroonCanadaCaribbeanCentral AmericaChileChinaColombiaCongoCosta RicaCroatiaCubaCzechoslovakiaDenmarkDominicaDominican RepublicEastern AfricaEastern AsiaEastern EuropeEcuadorEgyptEl SalvadorEnglandEritreaEthiopiaEuropeFijiFranceGermanyGhanaGreeceGrenadaGuatemalaGuyanaHaitiHondurasHong KongHungaryIndiaIndonesiaIranIraqIrelandIsraelItalyJamaicaJapanJordanKazakhstanKenyaKoreaKuwaitLaosLatin AmericaLatviaLebanonLiberiaLithuaniaMalaysiaMexicoMicronesiaMiddle AfricaMoldovaMoroccoNepalNetherlandsNicaraguaNigeriaNorth AmericaNorth MacedoniaNorthern AfricaNorthern EuropeNorwayOceaniaPakistanPanamaPeruPhilippinesPolandPortugalRomaniaRussiaSaudi ArabiaScotlandSenegalSerbiaSierra LeoneSingaporeSomaliaSouth AfricaSouth AmericaSouth Central AsiaSouth Eastern AsiaSouthern EuropeSpainSri LankaSt. Vincent and the GrenadinesSudanSwedenSwitzerlandSyriaTaiwanThailandTrinidad and TobagoTurkeyUgandaUkraineUruguayUzbekistanVenezuelaVietnamWest IndiesWestern AfricaWestern AsiaWestern EuropeYemenZaireZimbabweAzores
Unemployment Among Seniors over 75 years
Income
Poverty
Unemployment
Labor Participation
Family Structure
Vehicle Availability
Education Level
Disability

Unemployment Among Seniors over 75 years Comparison

Cypriots

Immigrants from Germany

Exceptional
Tragic
7.4%
UNEMPLOYMENT AMONG SENIORS OVER 75 YEARS
100.0/ 100
METRIC RATING
22nd/ 347
METRIC RANK
9.2%
UNEMPLOYMENT AMONG SENIORS OVER 75 YEARS
2.7/ 100
METRIC RATING
244th/ 347
METRIC RANK

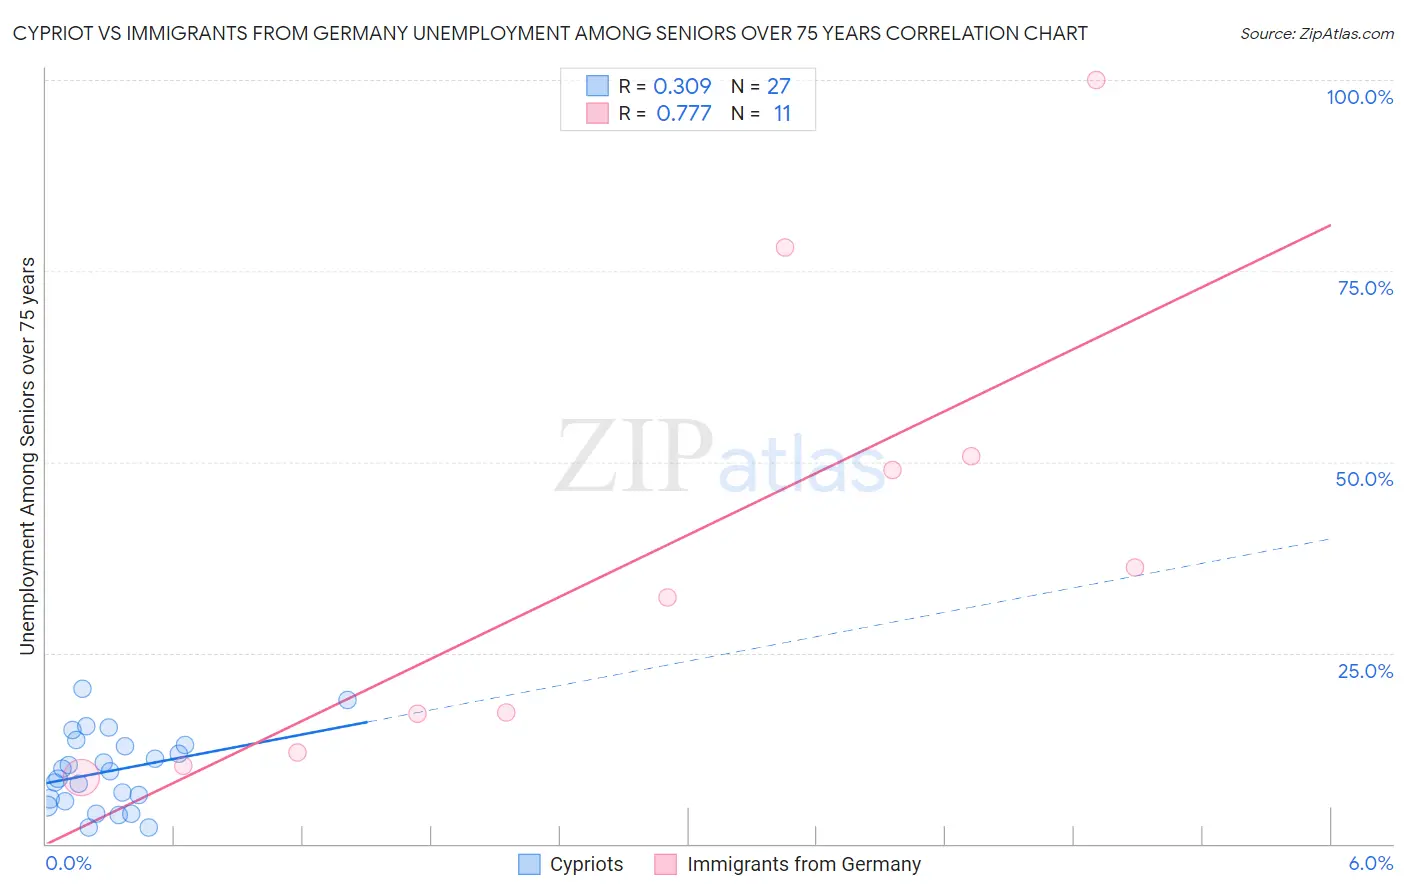
Cypriot vs Immigrants from Germany Unemployment Among Seniors over 75 years Correlation Chart

The statistical analysis conducted on geographies consisting of 50,854,533 people shows a mild positive correlation between the proportion of Cypriots and unemployment rate among seniors over the age of 75 in the United States with a correlation coefficient (R) of 0.309 and weighted average of 7.4%. Similarly, the statistical analysis conducted on geographies consisting of 218,928,696 people shows a strong positive correlation between the proportion of Immigrants from Germany and unemployment rate among seniors over the age of 75 in the United States with a correlation coefficient (R) of 0.777 and weighted average of 9.2%, a difference of 23.8%.
Cypriot vs Immigrants from Germany Unemployment Among Seniors over 75 years

Unemployment Among Seniors over 75 years Correlation Summary

MeasurementCypriotImmigrants from Germany
Minimum2.0%8.7%
Maximum20.3%100.0%
Range18.2%91.3%
Mean9.5%37.4%
Median9.5%32.3%
Interquartile 25% (IQ1)5.5%12.0%
Interquartile 75% (IQ3)13.0%50.7%
Interquartile Range (IQR)7.5%38.7%
Standard Deviation (Sample)4.9%29.9%
Standard Deviation (Population)4.8%28.5%

Similar Demographics by Unemployment Among Seniors over 75 years

Demographics Similar to Cypriots by Unemployment Among Seniors over 75 years

In terms of unemployment among seniors over 75 years, the demographic groups most similar to Cypriots are Israeli (7.4%, a difference of 0.33%), Immigrants from Cuba (7.4%, a difference of 0.41%), Chickasaw (7.3%, a difference of 0.76%), Immigrants from Uruguay (7.5%, a difference of 1.5%), and South African (7.5%, a difference of 1.7%).
DemographicsRating | RankUnemployment Among Seniors over 75 years
Icelanders
100.0
/100
|
#15
Exceptional
7.0%
Seminole
100.0
/100
|
#16
Exceptional
7.1%
Immigrants | Switzerland
100.0
/100
|
#17
Exceptional
7.2%
Immigrants | Uzbekistan
100.0
/100
|
#18
Exceptional
7.2%
Immigrants | Zaire
100.0
/100
|
#19
Exceptional
7.2%
Armenians
100.0
/100
|
#20
Exceptional
7.2%
Chickasaw
100.0
/100
|
#21
Exceptional
7.3%
Cypriots
100.0
/100
|
#22
Exceptional
7.4%
Israelis
100.0
/100
|
#23
Exceptional
7.4%
Immigrants | Cuba
100.0
/100
|
#24
Exceptional
7.4%
Immigrants | Uruguay
100.0
/100
|
#25
Exceptional
7.5%
South Africans
100.0
/100
|
#26
Exceptional
7.5%
Immigrants | Barbados
100.0
/100
|
#27
Exceptional
7.6%
Immigrants | Israel
100.0
/100
|
#28
Exceptional
7.6%
Immigrants | Iran
100.0
/100
|
#29
Exceptional
7.6%

Demographics Similar to Immigrants from Germany by Unemployment Among Seniors over 75 years

In terms of unemployment among seniors over 75 years, the demographic groups most similar to Immigrants from Germany are Sierra Leonean (9.2%, a difference of 0.030%), Slavic (9.2%, a difference of 0.030%), Immigrants from Southern Europe (9.2%, a difference of 0.060%), Immigrants from Canada (9.2%, a difference of 0.060%), and Immigrants from North America (9.2%, a difference of 0.18%).
DemographicsRating | RankUnemployment Among Seniors over 75 years
Houma
3.9
/100
|
#237
Tragic
9.1%
Inupiat
3.6
/100
|
#238
Tragic
9.1%
Mexicans
3.5
/100
|
#239
Tragic
9.1%
Spanish
3.3
/100
|
#240
Tragic
9.1%
Immigrants | Southern Europe
2.8
/100
|
#241
Tragic
9.2%
Sierra Leoneans
2.8
/100
|
#242
Tragic
9.2%
Slavs
2.8
/100
|
#243
Tragic
9.2%
Immigrants | Germany
2.7
/100
|
#244
Tragic
9.2%
Immigrants | Canada
2.6
/100
|
#245
Tragic
9.2%
Immigrants | North America
2.4
/100
|
#246
Tragic
9.2%
Sub-Saharan Africans
2.3
/100
|
#247
Tragic
9.2%
Blackfeet
2.3
/100
|
#248
Tragic
9.2%
Immigrants | Saudi Arabia
2.2
/100
|
#249
Tragic
9.2%
Central American Indians
2.2
/100
|
#250
Tragic
9.2%
Immigrants | Poland
2.0
/100
|
#251
Tragic
9.2%