Cuban vs Ecuadorian Unemployment Among Ages 45 to 54 years
COMPARE
Cuban
Ecuadorian
Unemployment Among Ages 45 to 54 years
Unemployment Among Ages 45 to 54 years Comparison
Cubans
Ecuadorians
4.0%
UNEMPLOYMENT AMONG AGES 45 TO 54 YEARS
100.0/ 100
METRIC RATING
13th/ 347
METRIC RANK
5.3%
UNEMPLOYMENT AMONG AGES 45 TO 54 YEARS
0.0/ 100
METRIC RATING
299th/ 347
METRIC RANK
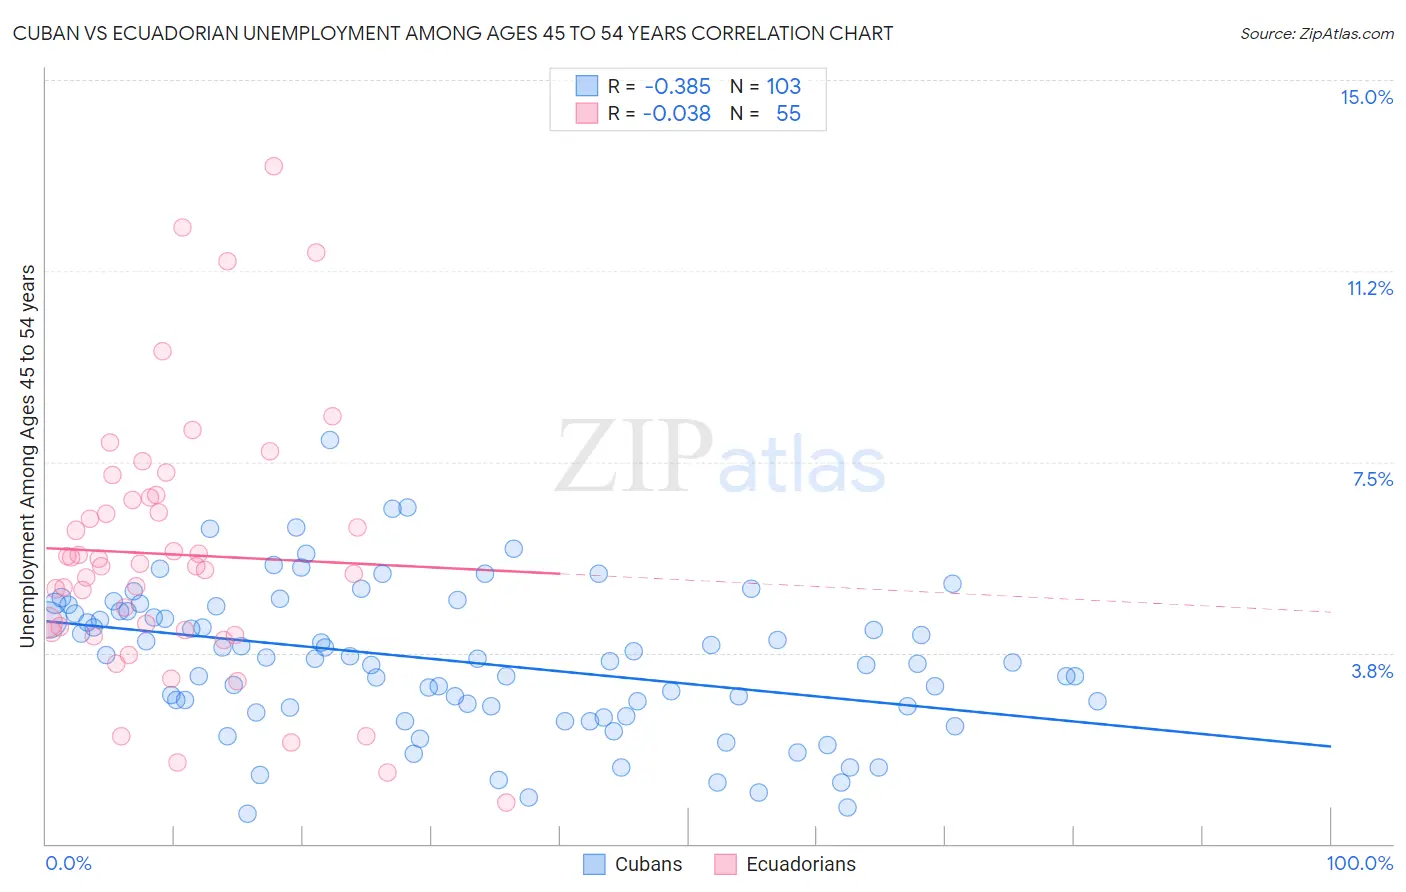
Cuban vs Ecuadorian Unemployment Among Ages 45 to 54 years Correlation Chart
The statistical analysis conducted on geographies consisting of 435,915,354 people shows a mild negative correlation between the proportion of Cubans and unemployment rate among population between the ages 45 and 54 in the United States with a correlation coefficient (R) of -0.385 and weighted average of 4.0%. Similarly, the statistical analysis conducted on geographies consisting of 312,530,580 people shows no correlation between the proportion of Ecuadorians and unemployment rate among population between the ages 45 and 54 in the United States with a correlation coefficient (R) of -0.038 and weighted average of 5.3%, a difference of 31.6%.
Unemployment Among Ages 45 to 54 years Correlation Summary
| Measurement | Cuban | Ecuadorian |
| Minimum | 0.60% | 0.80% |
| Maximum | 7.9% | 13.3% |
| Range | 7.3% | 12.5% |
| Mean | 3.6% | 5.7% |
| Median | 3.6% | 5.4% |
| Interquartile 25% (IQ1) | 2.7% | 4.2% |
| Interquartile 75% (IQ3) | 4.6% | 6.8% |
| Interquartile Range (IQR) | 1.9% | 2.6% |
| Standard Deviation (Sample) | 1.4% | 2.6% |
| Standard Deviation (Population) | 1.4% | 2.6% |
Similar Demographics by Unemployment Among Ages 45 to 54 years
Demographics Similar to Cubans by Unemployment Among Ages 45 to 54 years
In terms of unemployment among ages 45 to 54 years, the demographic groups most similar to Cubans are Immigrants from Bosnia and Herzegovina (4.0%, a difference of 0.050%), Swedish (4.0%, a difference of 0.15%), Scandinavian (4.0%, a difference of 0.16%), Venezuelan (4.0%, a difference of 0.30%), and Immigrants from Bolivia (4.0%, a difference of 0.48%).
| Demographics | Rating | Rank | Unemployment Among Ages 45 to 54 years |
| Immigrants | Cuba | 100.0 /100 | #6 | Exceptional 3.9% |
| Immigrants | Venezuela | 100.0 /100 | #7 | Exceptional 3.9% |
| Chinese | 100.0 /100 | #8 | Exceptional 4.0% |
| Czechs | 100.0 /100 | #9 | Exceptional 4.0% |
| Venezuelans | 100.0 /100 | #10 | Exceptional 4.0% |
| Scandinavians | 100.0 /100 | #11 | Exceptional 4.0% |
| Swedes | 100.0 /100 | #12 | Exceptional 4.0% |
| Cubans | 100.0 /100 | #13 | Exceptional 4.0% |
| Immigrants | Bosnia and Herzegovina | 100.0 /100 | #14 | Exceptional 4.0% |
| Immigrants | Bolivia | 100.0 /100 | #15 | Exceptional 4.0% |
| Thais | 100.0 /100 | #16 | Exceptional 4.0% |
| Tongans | 100.0 /100 | #17 | Exceptional 4.1% |
| Germans | 100.0 /100 | #18 | Exceptional 4.1% |
| Swiss | 100.0 /100 | #19 | Exceptional 4.1% |
| English | 100.0 /100 | #20 | Exceptional 4.1% |
Demographics Similar to Ecuadorians by Unemployment Among Ages 45 to 54 years
In terms of unemployment among ages 45 to 54 years, the demographic groups most similar to Ecuadorians are Immigrants from Trinidad and Tobago (5.3%, a difference of 0.020%), Aleut (5.3%, a difference of 0.14%), West Indian (5.3%, a difference of 0.14%), Central American Indian (5.3%, a difference of 0.21%), and Jamaican (5.3%, a difference of 0.33%).
| Demographics | Rating | Rank | Unemployment Among Ages 45 to 54 years |
| Trinidadians and Tobagonians | 0.0 /100 | #292 | Tragic 5.2% |
| Immigrants | Senegal | 0.0 /100 | #293 | Tragic 5.2% |
| Belizeans | 0.0 /100 | #294 | Tragic 5.2% |
| Jamaicans | 0.0 /100 | #295 | Tragic 5.3% |
| Aleuts | 0.0 /100 | #296 | Tragic 5.3% |
| West Indians | 0.0 /100 | #297 | Tragic 5.3% |
| Immigrants | Trinidad and Tobago | 0.0 /100 | #298 | Tragic 5.3% |
| Ecuadorians | 0.0 /100 | #299 | Tragic 5.3% |
| Central American Indians | 0.0 /100 | #300 | Tragic 5.3% |
| Menominee | 0.0 /100 | #301 | Tragic 5.3% |
| Immigrants | Ecuador | 0.0 /100 | #302 | Tragic 5.3% |
| Immigrants | Belize | 0.0 /100 | #303 | Tragic 5.3% |
| Immigrants | Jamaica | 0.0 /100 | #304 | Tragic 5.4% |
| Immigrants | West Indies | 0.0 /100 | #305 | Tragic 5.4% |
| Immigrants | Bangladesh | 0.0 /100 | #306 | Tragic 5.4% |