Croatian vs Dutch West Indian Unemployment Among Women with Children Under 18 years

COMPARE

Croatian
Race
Ancestry
AfghanAfricanAlaska NativeAlaskan AthabascanAlbanianAleutAlsatianAmericanApacheArabArapahoArgentineanArmenianAssyrian/Chaldean/SyriacAustralianAustrianBahamianBangladeshiBarbadianBasqueBelgianBelizeanBermudanBhutaneseBlackfeetBolivianBrazilianBritishBritish West IndianBulgarianBurmeseCajunCambodianCanadianCape VerdeanCarpatho RusynCelticCentral AmericanCentral American IndianCherokeeCheyenneChickasawChileanChineseChippewaChoctawColombianColvilleComancheCosta RicanCreeCreekCroatianCrowCubanCypriotCzechCzechoslovakianDanishDelawareDominicanDutchEastern EuropeanEcuadorianEgyptianEnglishEstonianEthiopianEuropeanFijianFilipinoFinnishFrenchFrench American IndianFrench CanadianGermanGerman RussianGhanaianGreekGuamanian/ChamorroGuatemalanGuyaneseHaitianHmongHonduranHopiHoumaHungarianIcelanderIndian (Asian)IndonesianInupiatIranianIraqiIrishIroquoisIsraeliItalianJamaicanJapaneseJordanianKenyanKiowaKoreanLaotianLatvianLebaneseLiberianLithuanianLumbeeLuxembourgerMacedonianMalaysianMalteseMarshalleseMenomineeMexicanMexican American IndianMongolianMoroccanNative HawaiianNavajoNepaleseNew ZealanderNicaraguanNigerianNorthern EuropeanNorwegianOkinawanOsageOttawaPaiutePakistaniPalestinianPanamanianParaguayanPennsylvania GermanPeruvianPimaPolishPortuguesePotawatomiPuebloPuerto RicanPuget Sound SalishRomanianRussianSalvadoranSamoanScandinavianScotch-IrishScottishSeminoleSenegaleseSerbianShoshoneSierra LeoneanSiouxSlavicSlovakSloveneSomaliSouth AfricanSouth AmericanSouth American IndianSoviet UnionSpaniardSpanishSpanish AmericanSpanish American IndianSri LankanSubsaharan AfricanSudaneseSwedishSwissSyrianTaiwaneseThaiTlingit-HaidaTohono O'OdhamTonganTrinidadian and TobagonianTsimshianTurkishU.S. Virgin IslanderUgandanUkrainianUruguayanUteVenezuelanVietnameseWelshWest IndianYakamaYaquiYugoslavianYumanYup'ikZimbabwean
Immigration
NonimmigrantsImmigrantsAfghanistanAfricaAlbaniaArgentinaArmeniaAsiaAustraliaAustriaBahamasBangladeshBarbadosBelarusBelgiumBelizeBoliviaBosnia and HerzegovinaBrazilBulgariaBurma/MyanmarCabo VerdeCambodiaCameroonCanadaCaribbeanCentral AmericaChileChinaColombiaCongoCosta RicaCroatiaCubaCzechoslovakiaDenmarkDominicaDominican RepublicEastern AfricaEastern AsiaEastern EuropeEcuadorEgyptEl SalvadorEnglandEritreaEthiopiaEuropeFijiFranceGermanyGhanaGreeceGrenadaGuatemalaGuyanaHaitiHondurasHong KongHungaryIndiaIndonesiaIranIraqIrelandIsraelItalyJamaicaJapanJordanKazakhstanKenyaKoreaKuwaitLaosLatin AmericaLatviaLebanonLiberiaLithuaniaMalaysiaMexicoMicronesiaMiddle AfricaMoldovaMoroccoNepalNetherlandsNicaraguaNigeriaNorth AmericaNorth MacedoniaNorthern AfricaNorthern EuropeNorwayOceaniaPakistanPanamaPeruPhilippinesPolandPortugalRomaniaRussiaSaudi ArabiaScotlandSenegalSerbiaSierra LeoneSingaporeSomaliaSouth AfricaSouth AmericaSouth Central AsiaSouth Eastern AsiaSouthern EuropeSpainSri LankaSt. Vincent and the GrenadinesSudanSwedenSwitzerlandSyriaTaiwanThailandTrinidad and TobagoTurkeyUgandaUkraineUruguayUzbekistanVenezuelaVietnamWest IndiesWestern AfricaWestern AsiaWestern EuropeYemenZaireZimbabweAzores
Dutch West Indian
Race
Ancestry
AfghanAfricanAlaska NativeAlaskan AthabascanAlbanianAleutAlsatianAmericanApacheArabArapahoArgentineanArmenianAssyrian/Chaldean/SyriacAustralianAustrianBahamianBangladeshiBarbadianBasqueBelgianBelizeanBermudanBhutaneseBlackfeetBolivianBrazilianBritishBritish West IndianBulgarianBurmeseCajunCambodianCanadianCape VerdeanCarpatho RusynCelticCentral AmericanCentral American IndianCherokeeCheyenneChickasawChileanChineseChippewaChoctawColombianColvilleComancheCosta RicanCreeCreekCrowCubanCypriotCzechCzechoslovakianDanishDelawareDominicanDutchDutch West IndianEastern EuropeanEcuadorianEgyptianEnglishEstonianEthiopianEuropeanFijianFilipinoFinnishFrenchFrench American IndianFrench CanadianGermanGerman RussianGhanaianGreekGuamanian/ChamorroGuatemalanGuyaneseHaitianHmongHonduranHopiHoumaHungarianIcelanderIndian (Asian)IndonesianInupiatIranianIraqiIrishIroquoisIsraeliItalianJamaicanJapaneseJordanianKenyanKiowaKoreanLaotianLatvianLebaneseLiberianLithuanianLumbeeLuxembourgerMacedonianMalaysianMalteseMarshalleseMenomineeMexicanMexican American IndianMongolianMoroccanNative HawaiianNavajoNepaleseNew ZealanderNicaraguanNigerianNorthern EuropeanNorwegianOkinawanOsageOttawaPaiutePakistaniPalestinianPanamanianParaguayanPennsylvania GermanPeruvianPimaPolishPortuguesePotawatomiPuebloPuerto RicanPuget Sound SalishRomanianRussianSalvadoranSamoanScandinavianScotch-IrishScottishSeminoleSenegaleseSerbianShoshoneSierra LeoneanSiouxSlavicSlovakSloveneSomaliSouth AfricanSouth AmericanSouth American IndianSoviet UnionSpaniardSpanishSpanish AmericanSpanish American IndianSri LankanSubsaharan AfricanSudaneseSwedishSwissSyrianTaiwaneseThaiTlingit-HaidaTohono O'OdhamTonganTrinidadian and TobagonianTsimshianTurkishU.S. Virgin IslanderUgandanUkrainianUruguayanUteVenezuelanVietnameseWelshWest IndianYakamaYaquiYugoslavianYumanYup'ikZimbabwean
Immigration
NonimmigrantsImmigrantsAfghanistanAfricaAlbaniaArgentinaArmeniaAsiaAustraliaAustriaBahamasBangladeshBarbadosBelarusBelgiumBelizeBoliviaBosnia and HerzegovinaBrazilBulgariaBurma/MyanmarCabo VerdeCambodiaCameroonCanadaCaribbeanCentral AmericaChileChinaColombiaCongoCosta RicaCroatiaCubaCzechoslovakiaDenmarkDominicaDominican RepublicEastern AfricaEastern AsiaEastern EuropeEcuadorEgyptEl SalvadorEnglandEritreaEthiopiaEuropeFijiFranceGermanyGhanaGreeceGrenadaGuatemalaGuyanaHaitiHondurasHong KongHungaryIndiaIndonesiaIranIraqIrelandIsraelItalyJamaicaJapanJordanKazakhstanKenyaKoreaKuwaitLaosLatin AmericaLatviaLebanonLiberiaLithuaniaMalaysiaMexicoMicronesiaMiddle AfricaMoldovaMoroccoNepalNetherlandsNicaraguaNigeriaNorth AmericaNorth MacedoniaNorthern AfricaNorthern EuropeNorwayOceaniaPakistanPanamaPeruPhilippinesPolandPortugalRomaniaRussiaSaudi ArabiaScotlandSenegalSerbiaSierra LeoneSingaporeSomaliaSouth AfricaSouth AmericaSouth Central AsiaSouth Eastern AsiaSouthern EuropeSpainSri LankaSt. Vincent and the GrenadinesSudanSwedenSwitzerlandSyriaTaiwanThailandTrinidad and TobagoTurkeyUgandaUkraineUruguayUzbekistanVenezuelaVietnamWest IndiesWestern AfricaWestern AsiaWestern EuropeYemenZaireZimbabweAzores
Unemployment Among Women with Children Under 18 years
Income
Poverty
Unemployment
Labor Participation
Family Structure
Vehicle Availability
Education Level
Disability

Unemployment Among Women with Children Under 18 years Comparison

Croatians

Dutch West Indians

Exceptional
Tragic
5.0%
UNEMPLOYMENT AMONG WOMEN WITH CHILDREN UNDER 18 YEARS
99.3/ 100
METRIC RATING
33rd/ 347
METRIC RANK
6.2%
UNEMPLOYMENT AMONG WOMEN WITH CHILDREN UNDER 18 YEARS
0.0/ 100
METRIC RATING
275th/ 347
METRIC RANK

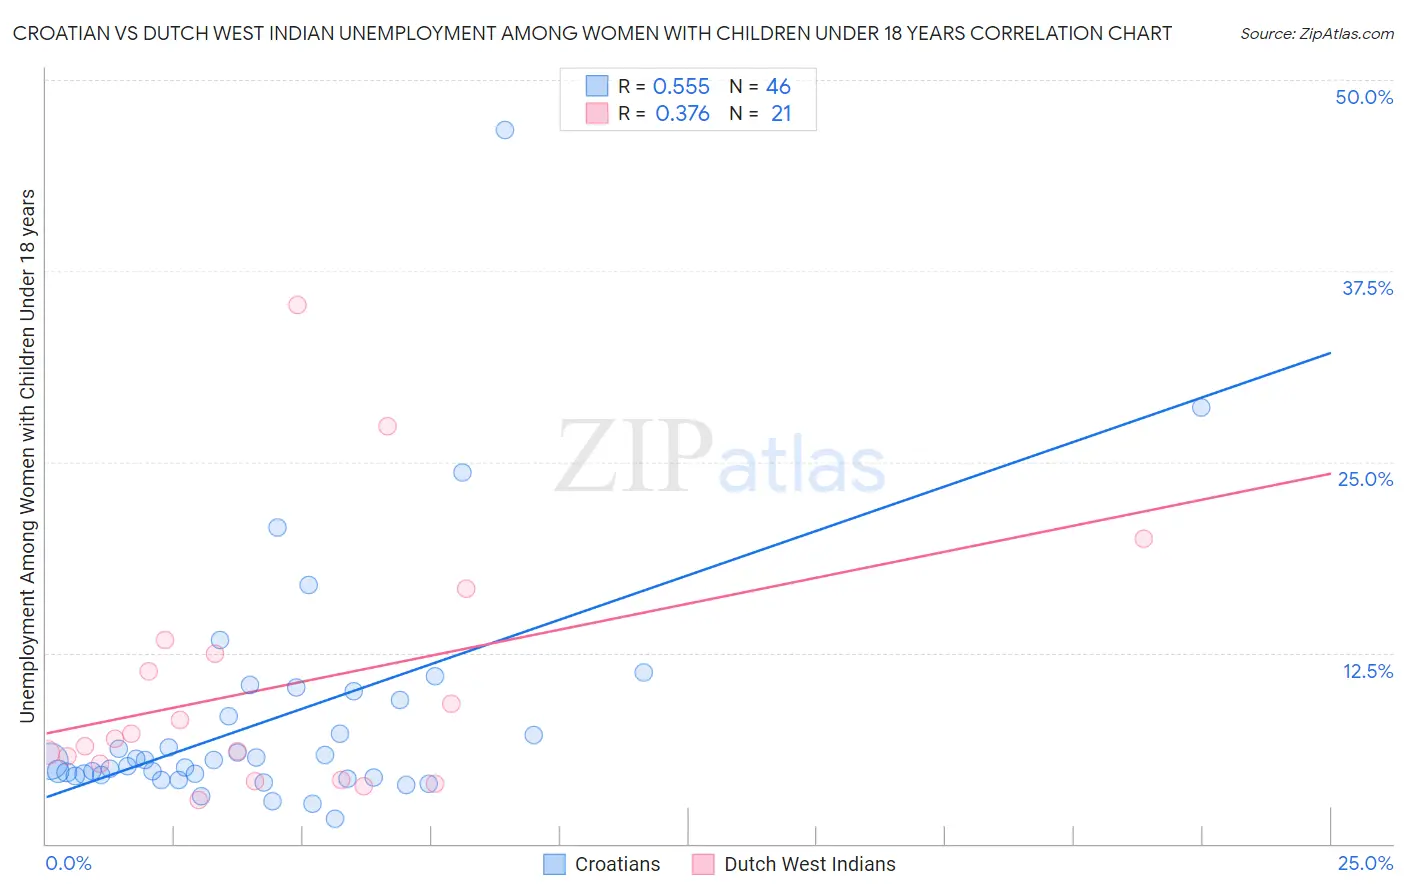
Croatian vs Dutch West Indian Unemployment Among Women with Children Under 18 years Correlation Chart

The statistical analysis conducted on geographies consisting of 358,005,855 people shows a substantial positive correlation between the proportion of Croatians and unemployment rate among women with children under the age of 18 in the United States with a correlation coefficient (R) of 0.555 and weighted average of 5.0%. Similarly, the statistical analysis conducted on geographies consisting of 84,109,270 people shows a mild positive correlation between the proportion of Dutch West Indians and unemployment rate among women with children under the age of 18 in the United States with a correlation coefficient (R) of 0.376 and weighted average of 6.2%, a difference of 25.3%.
Croatian vs Dutch West Indian Unemployment Among Women with Children Under 18 years

Unemployment Among Women with Children Under 18 years Correlation Summary

MeasurementCroatianDutch West Indian
Minimum1.6%2.9%
Maximum46.7%35.3%
Range45.1%32.4%
Mean8.2%10.3%
Median5.4%6.9%
Interquartile 25% (IQ1)4.5%4.7%
Interquartile 75% (IQ3)9.4%12.9%
Interquartile Range (IQR)5.0%8.1%
Standard Deviation (Sample)8.0%8.4%
Standard Deviation (Population)7.9%8.2%

Similar Demographics by Unemployment Among Women with Children Under 18 years

Demographics Similar to Croatians by Unemployment Among Women with Children Under 18 years

In terms of unemployment among women with children under 18 years, the demographic groups most similar to Croatians are Dutch (5.0%, a difference of 0.020%), Cypriot (5.0%, a difference of 0.12%), Immigrants from South Central Asia (5.0%, a difference of 0.20%), Luxembourger (5.0%, a difference of 0.25%), and Mongolian (5.0%, a difference of 0.32%).
DemographicsRating | RankUnemployment Among Women with Children Under 18 years
Swiss
99.5
/100
|
#26
Exceptional
4.9%
Soviet Union
99.5
/100
|
#27
Exceptional
4.9%
Immigrants | Eastern Asia
99.5
/100
|
#28
Exceptional
4.9%
Finns
99.4
/100
|
#29
Exceptional
4.9%
Burmese
99.4
/100
|
#30
Exceptional
4.9%
Cypriots
99.3
/100
|
#31
Exceptional
5.0%
Dutch
99.3
/100
|
#32
Exceptional
5.0%
Croatians
99.3
/100
|
#33
Exceptional
5.0%
Immigrants | South Central Asia
99.2
/100
|
#34
Exceptional
5.0%
Luxembourgers
99.2
/100
|
#35
Exceptional
5.0%
Mongolians
99.2
/100
|
#36
Exceptional
5.0%
Poles
99.2
/100
|
#37
Exceptional
5.0%
Bhutanese
99.2
/100
|
#38
Exceptional
5.0%
English
99.1
/100
|
#39
Exceptional
5.0%
Greeks
99.0
/100
|
#40
Exceptional
5.0%

Demographics Similar to Dutch West Indians by Unemployment Among Women with Children Under 18 years

In terms of unemployment among women with children under 18 years, the demographic groups most similar to Dutch West Indians are Immigrants from Ghana (6.2%, a difference of 0.11%), Mexican American Indian (6.2%, a difference of 0.12%), Immigrants from Barbados (6.2%, a difference of 0.13%), Senegalese (6.2%, a difference of 0.18%), and Immigrants from Western Africa (6.2%, a difference of 0.19%).
DemographicsRating | RankUnemployment Among Women with Children Under 18 years
Trinidadians and Tobagonians
0.1
/100
|
#268
Tragic
6.2%
Cajuns
0.1
/100
|
#269
Tragic
6.2%
Ghanaians
0.1
/100
|
#270
Tragic
6.2%
Central Americans
0.0
/100
|
#271
Tragic
6.2%
Salvadorans
0.0
/100
|
#272
Tragic
6.2%
Immigrants | Western Africa
0.0
/100
|
#273
Tragic
6.2%
Senegalese
0.0
/100
|
#274
Tragic
6.2%
Dutch West Indians
0.0
/100
|
#275
Tragic
6.2%
Immigrants | Ghana
0.0
/100
|
#276
Tragic
6.2%
Mexican American Indians
0.0
/100
|
#277
Tragic
6.2%
Immigrants | Barbados
0.0
/100
|
#278
Tragic
6.2%
Immigrants | Portugal
0.0
/100
|
#279
Tragic
6.3%
Guatemalans
0.0
/100
|
#280
Tragic
6.3%
Immigrants | El Salvador
0.0
/100
|
#281
Tragic
6.3%
Immigrants | St. Vincent and the Grenadines
0.0
/100
|
#282
Tragic
6.3%