Costa Rican vs Taiwanese Unemployment Among Ages 30 to 34 years

COMPARE

Costa Rican
Race
Ancestry
AfghanAfricanAlaska NativeAlaskan AthabascanAlbanianAleutAlsatianAmericanApacheArabArapahoArgentineanArmenianAssyrian/Chaldean/SyriacAustralianAustrianBahamianBangladeshiBarbadianBasqueBelgianBelizeanBermudanBhutaneseBlackfeetBolivianBrazilianBritishBritish West IndianBulgarianBurmeseCajunCambodianCanadianCape VerdeanCarpatho RusynCelticCentral AmericanCentral American IndianCherokeeCheyenneChickasawChileanChineseChippewaChoctawColombianColvilleComancheCosta RicanCreeCreekCroatianCrowCubanCypriotCzechCzechoslovakianDanishDelawareDominicanDutchDutch West IndianEastern EuropeanEcuadorianEgyptianEnglishEstonianEthiopianEuropeanFijianFilipinoFinnishFrenchFrench American IndianFrench CanadianGermanGerman RussianGhanaianGreekGuamanian/ChamorroGuatemalanGuyaneseHaitianHmongHonduranHopiHoumaHungarianIcelanderIndian (Asian)IndonesianInupiatIranianIraqiIrishIroquoisIsraeliItalianJamaicanJapaneseJordanianKenyanKiowaKoreanLaotianLatvianLebaneseLiberianLithuanianLumbeeLuxembourgerMacedonianMalaysianMalteseMarshalleseMenomineeMexicanMexican American IndianMongolianMoroccanNative HawaiianNavajoNepaleseNew ZealanderNicaraguanNigerianNorthern EuropeanNorwegianOkinawanOsageOttawaPaiutePakistaniPalestinianPanamanianParaguayanPennsylvania GermanPeruvianPimaPolishPortuguesePotawatomiPuebloPuerto RicanPuget Sound SalishRomanianRussianSalvadoranSamoanScandinavianScotch-IrishScottishSeminoleSenegaleseSerbianShoshoneSierra LeoneanSiouxSlavicSlovakSloveneSomaliSouth AfricanSouth AmericanSouth American IndianSoviet UnionSpaniardSpanishSpanish AmericanSpanish American IndianSri LankanSubsaharan AfricanSudaneseSwedishSwissSyrianThaiTlingit-HaidaTohono O'OdhamTonganTrinidadian and TobagonianTsimshianTurkishU.S. Virgin IslanderUgandanUkrainianUruguayanUteVenezuelanVietnameseWelshWest IndianYakamaYaquiYugoslavianYumanYup'ikZimbabwean
Immigration
NonimmigrantsImmigrantsAfghanistanAfricaAlbaniaArgentinaArmeniaAsiaAustraliaAustriaBahamasBangladeshBarbadosBelarusBelgiumBelizeBoliviaBosnia and HerzegovinaBrazilBulgariaBurma/MyanmarCabo VerdeCambodiaCameroonCanadaCaribbeanCentral AmericaChileChinaColombiaCongoCosta RicaCroatiaCubaCzechoslovakiaDenmarkDominicaDominican RepublicEastern AfricaEastern AsiaEastern EuropeEcuadorEgyptEl SalvadorEnglandEritreaEthiopiaEuropeFijiFranceGermanyGhanaGreeceGrenadaGuatemalaGuyanaHaitiHondurasHong KongHungaryIndiaIndonesiaIranIraqIrelandIsraelItalyJamaicaJapanJordanKazakhstanKenyaKoreaKuwaitLaosLatin AmericaLatviaLebanonLiberiaLithuaniaMalaysiaMexicoMicronesiaMiddle AfricaMoldovaMoroccoNepalNetherlandsNicaraguaNigeriaNorth AmericaNorth MacedoniaNorthern AfricaNorthern EuropeNorwayOceaniaPakistanPanamaPeruPhilippinesPolandPortugalRomaniaRussiaSaudi ArabiaScotlandSenegalSerbiaSierra LeoneSingaporeSomaliaSouth AfricaSouth AmericaSouth Central AsiaSouth Eastern AsiaSouthern EuropeSpainSri LankaSt. Vincent and the GrenadinesSudanSwedenSwitzerlandSyriaTaiwanThailandTrinidad and TobagoTurkeyUgandaUkraineUruguayUzbekistanVenezuelaVietnamWest IndiesWestern AfricaWestern AsiaWestern EuropeYemenZaireZimbabweAzores
Taiwanese
Race
Ancestry
AfghanAfricanAlaska NativeAlaskan AthabascanAlbanianAleutAlsatianAmericanApacheArabArapahoArgentineanArmenianAssyrian/Chaldean/SyriacAustralianAustrianBahamianBangladeshiBarbadianBasqueBelgianBelizeanBermudanBhutaneseBlackfeetBolivianBrazilianBritishBritish West IndianBulgarianBurmeseCajunCambodianCanadianCape VerdeanCarpatho RusynCelticCentral AmericanCentral American IndianCherokeeCheyenneChickasawChileanChineseChippewaChoctawColombianColvilleComancheCreeCreekCroatianCrowCubanCypriotCzechCzechoslovakianDanishDelawareDominicanDutchDutch West IndianEastern EuropeanEcuadorianEgyptianEnglishEstonianEthiopianEuropeanFijianFilipinoFinnishFrenchFrench American IndianFrench CanadianGermanGerman RussianGhanaianGreekGuamanian/ChamorroGuatemalanGuyaneseHaitianHmongHonduranHopiHoumaHungarianIcelanderIndian (Asian)IndonesianInupiatIranianIraqiIrishIroquoisIsraeliItalianJamaicanJapaneseJordanianKenyanKiowaKoreanLaotianLatvianLebaneseLiberianLithuanianLumbeeLuxembourgerMacedonianMalaysianMalteseMarshalleseMenomineeMexicanMexican American IndianMongolianMoroccanNative HawaiianNavajoNepaleseNew ZealanderNicaraguanNigerianNorthern EuropeanNorwegianOkinawanOsageOttawaPaiutePakistaniPalestinianPanamanianParaguayanPennsylvania GermanPeruvianPimaPolishPortuguesePotawatomiPuebloPuerto RicanPuget Sound SalishRomanianRussianSalvadoranSamoanScandinavianScotch-IrishScottishSeminoleSenegaleseSerbianShoshoneSierra LeoneanSiouxSlavicSlovakSloveneSomaliSouth AfricanSouth AmericanSouth American IndianSoviet UnionSpaniardSpanishSpanish AmericanSpanish American IndianSri LankanSubsaharan AfricanSudaneseSwedishSwissSyrianTaiwaneseThaiTlingit-HaidaTohono O'OdhamTonganTrinidadian and TobagonianTsimshianTurkishU.S. Virgin IslanderUgandanUkrainianUruguayanUteVenezuelanVietnameseWelshWest IndianYakamaYaquiYugoslavianYumanYup'ikZimbabwean
Immigration
NonimmigrantsImmigrantsAfghanistanAfricaAlbaniaArgentinaArmeniaAsiaAustraliaAustriaBahamasBangladeshBarbadosBelarusBelgiumBelizeBoliviaBosnia and HerzegovinaBrazilBulgariaBurma/MyanmarCabo VerdeCambodiaCameroonCanadaCaribbeanCentral AmericaChileChinaColombiaCongoCosta RicaCroatiaCubaCzechoslovakiaDenmarkDominicaDominican RepublicEastern AfricaEastern AsiaEastern EuropeEcuadorEgyptEl SalvadorEnglandEritreaEthiopiaEuropeFijiFranceGermanyGhanaGreeceGrenadaGuatemalaGuyanaHaitiHondurasHong KongHungaryIndiaIndonesiaIranIraqIrelandIsraelItalyJamaicaJapanJordanKazakhstanKenyaKoreaKuwaitLaosLatin AmericaLatviaLebanonLiberiaLithuaniaMalaysiaMexicoMicronesiaMiddle AfricaMoldovaMoroccoNepalNetherlandsNicaraguaNigeriaNorth AmericaNorth MacedoniaNorthern AfricaNorthern EuropeNorwayOceaniaPakistanPanamaPeruPhilippinesPolandPortugalRomaniaRussiaSaudi ArabiaScotlandSenegalSerbiaSierra LeoneSingaporeSomaliaSouth AfricaSouth AmericaSouth Central AsiaSouth Eastern AsiaSouthern EuropeSpainSri LankaSt. Vincent and the GrenadinesSudanSwedenSwitzerlandSyriaTaiwanThailandTrinidad and TobagoTurkeyUgandaUkraineUruguayUzbekistanVenezuelaVietnamWest IndiesWestern AfricaWestern AsiaWestern EuropeYemenZaireZimbabweAzores
Unemployment Among Ages 30 to 34 years
Income
Poverty
Unemployment
Labor Participation
Family Structure
Vehicle Availability
Education Level
Disability

Unemployment Among Ages 30 to 34 years Comparison

Costa Ricans

Taiwanese

Average
Good
5.5%
UNEMPLOYMENT AMONG AGES 30 TO 34 YEARS
46.7/ 100
METRIC RATING
179th/ 347
METRIC RANK
5.3%
UNEMPLOYMENT AMONG AGES 30 TO 34 YEARS
79.4/ 100
METRIC RATING
127th/ 347
METRIC RANK

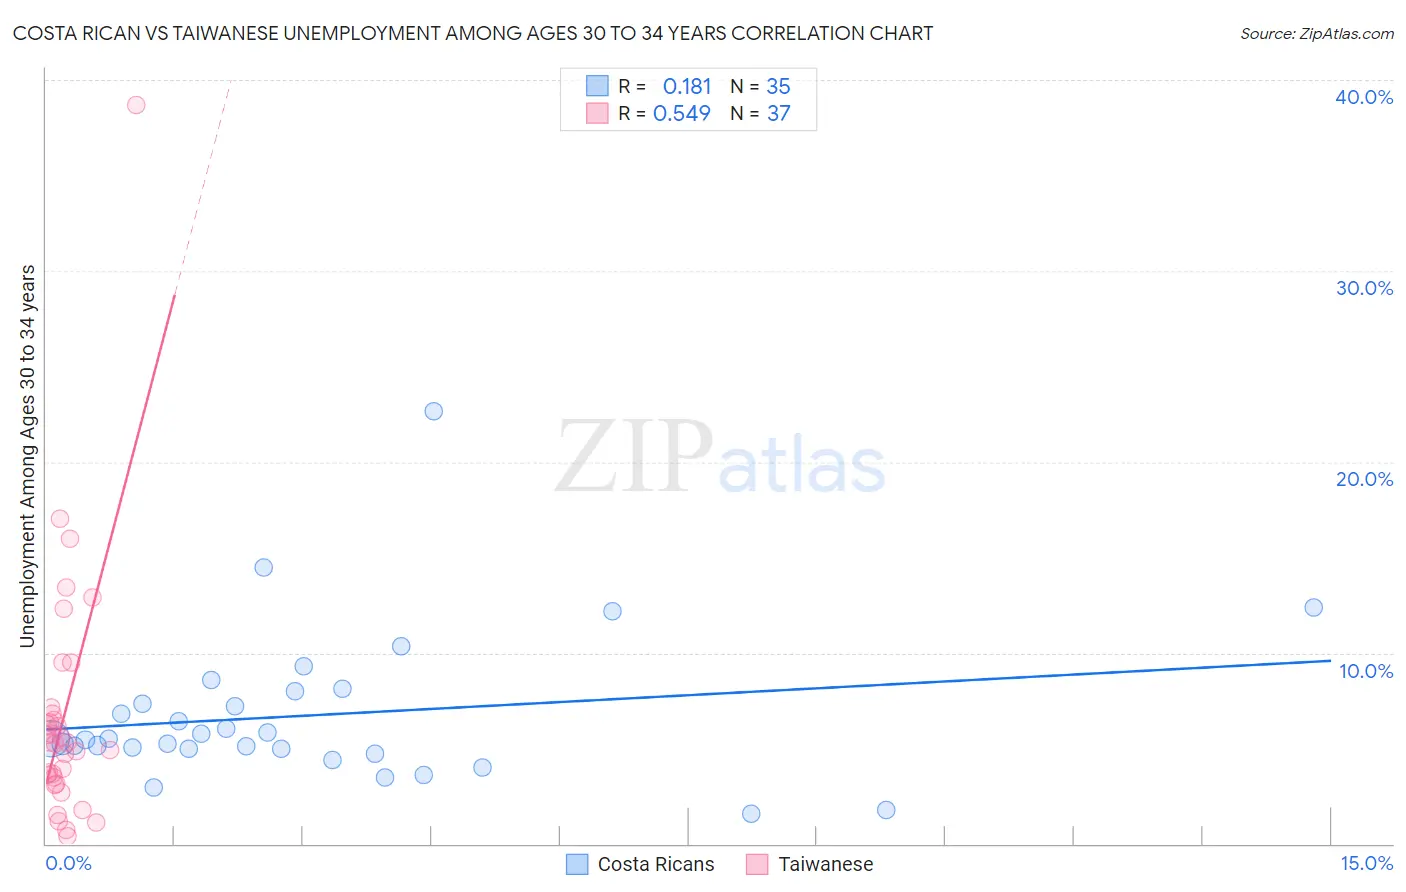
Costa Rican vs Taiwanese Unemployment Among Ages 30 to 34 years Correlation Chart

The statistical analysis conducted on geographies consisting of 245,985,362 people shows a poor positive correlation between the proportion of Costa Ricans and unemployment rate among population between the ages 30 and 34 in the United States with a correlation coefficient (R) of 0.181 and weighted average of 5.5%. Similarly, the statistical analysis conducted on geographies consisting of 31,645,332 people shows a substantial positive correlation between the proportion of Taiwanese and unemployment rate among population between the ages 30 and 34 in the United States with a correlation coefficient (R) of 0.549 and weighted average of 5.3%, a difference of 2.6%.
Costa Rican vs Taiwanese Unemployment Among Ages 30 to 34 years

Unemployment Among Ages 30 to 34 years Correlation Summary

MeasurementCosta RicanTaiwanese
Minimum1.6%0.40%
Maximum22.7%38.7%
Range21.1%38.3%
Mean6.7%6.8%
Median5.5%5.3%
Interquartile 25% (IQ1)5.0%3.3%
Interquartile 75% (IQ3)8.0%7.0%
Interquartile Range (IQR)3.0%3.7%
Standard Deviation (Sample)4.0%6.8%
Standard Deviation (Population)3.9%6.7%

Similar Demographics by Unemployment Among Ages 30 to 34 years

Demographics Similar to Costa Ricans by Unemployment Among Ages 30 to 34 years

In terms of unemployment among ages 30 to 34 years, the demographic groups most similar to Costa Ricans are Macedonian (5.5%, a difference of 0.020%), Immigrants from Ukraine (5.5%, a difference of 0.070%), Immigrants from Peru (5.5%, a difference of 0.090%), Italian (5.5%, a difference of 0.090%), and Afghan (5.5%, a difference of 0.20%).
DemographicsRating | RankUnemployment Among Ages 30 to 34 years
Immigrants | Austria
51.3
/100
|
#172
Average
5.5%
Peruvians
50.2
/100
|
#173
Average
5.5%
Immigrants | Laos
50.0
/100
|
#174
Average
5.5%
Afghans
49.6
/100
|
#175
Average
5.5%
Immigrants | Peru
48.0
/100
|
#176
Average
5.5%
Immigrants | Ukraine
47.7
/100
|
#177
Average
5.5%
Macedonians
47.1
/100
|
#178
Average
5.5%
Costa Ricans
46.7
/100
|
#179
Average
5.5%
Italians
45.5
/100
|
#180
Average
5.5%
Immigrants | Lebanon
43.5
/100
|
#181
Average
5.5%
Immigrants | Denmark
43.4
/100
|
#182
Average
5.5%
Hungarians
43.1
/100
|
#183
Average
5.5%
Malaysians
41.8
/100
|
#184
Average
5.5%
Immigrants | Western Europe
39.1
/100
|
#185
Fair
5.5%
Canadians
38.2
/100
|
#186
Fair
5.5%

Demographics Similar to Taiwanese by Unemployment Among Ages 30 to 34 years

In terms of unemployment among ages 30 to 34 years, the demographic groups most similar to Taiwanese are Immigrants from Uruguay (5.3%, a difference of 0.020%), Polish (5.3%, a difference of 0.070%), Immigrants from Sri Lanka (5.3%, a difference of 0.080%), Greek (5.3%, a difference of 0.11%), and Immigrants from Brazil (5.3%, a difference of 0.16%).
DemographicsRating | RankUnemployment Among Ages 30 to 34 years
Immigrants | Poland
82.4
/100
|
#120
Excellent
5.3%
Romanians
82.3
/100
|
#121
Excellent
5.3%
Immigrants | Netherlands
81.8
/100
|
#122
Excellent
5.3%
Immigrants | Italy
81.1
/100
|
#123
Excellent
5.3%
Immigrants | Brazil
80.8
/100
|
#124
Excellent
5.3%
Greeks
80.4
/100
|
#125
Excellent
5.3%
Immigrants | Sri Lanka
80.2
/100
|
#126
Excellent
5.3%
Taiwanese
79.4
/100
|
#127
Good
5.3%
Immigrants | Uruguay
79.3
/100
|
#128
Good
5.3%
Poles
78.8
/100
|
#129
Good
5.3%
Germans
77.8
/100
|
#130
Good
5.3%
Immigrants | Eastern Europe
77.4
/100
|
#131
Good
5.3%
Carpatho Rusyns
77.3
/100
|
#132
Good
5.3%
Immigrants | Northern Europe
77.3
/100
|
#133
Good
5.3%
Bangladeshis
76.6
/100
|
#134
Good
5.3%