Costa Rican vs Immigrants from Nicaragua Unemployment Among Ages 55 to 59 years

COMPARE

Costa Rican
Race
Ancestry
AfghanAfricanAlaska NativeAlaskan AthabascanAlbanianAleutAlsatianAmericanApacheArabArapahoArgentineanArmenianAssyrian/Chaldean/SyriacAustralianAustrianBahamianBangladeshiBarbadianBasqueBelgianBelizeanBermudanBhutaneseBlackfeetBolivianBrazilianBritishBritish West IndianBulgarianBurmeseCajunCambodianCanadianCape VerdeanCarpatho RusynCelticCentral AmericanCentral American IndianCherokeeCheyenneChickasawChileanChineseChippewaChoctawColombianColvilleComancheCosta RicanCreeCreekCroatianCrowCubanCypriotCzechCzechoslovakianDanishDelawareDominicanDutchDutch West IndianEastern EuropeanEcuadorianEgyptianEnglishEstonianEthiopianEuropeanFijianFilipinoFinnishFrenchFrench American IndianFrench CanadianGermanGerman RussianGhanaianGreekGuamanian/ChamorroGuatemalanGuyaneseHaitianHmongHonduranHopiHoumaHungarianIcelanderIndian (Asian)IndonesianInupiatIranianIraqiIrishIroquoisIsraeliItalianJamaicanJapaneseJordanianKenyanKiowaKoreanLaotianLatvianLebaneseLiberianLithuanianLumbeeLuxembourgerMacedonianMalaysianMalteseMarshalleseMenomineeMexicanMexican American IndianMongolianMoroccanNative HawaiianNavajoNepaleseNew ZealanderNicaraguanNigerianNorthern EuropeanNorwegianOkinawanOsageOttawaPaiutePakistaniPalestinianPanamanianParaguayanPennsylvania GermanPeruvianPimaPolishPortuguesePotawatomiPuebloPuerto RicanPuget Sound SalishRomanianRussianSalvadoranSamoanScandinavianScotch-IrishScottishSeminoleSenegaleseSerbianShoshoneSierra LeoneanSiouxSlavicSlovakSloveneSomaliSouth AfricanSouth AmericanSouth American IndianSoviet UnionSpaniardSpanishSpanish AmericanSpanish American IndianSri LankanSubsaharan AfricanSudaneseSwedishSwissSyrianTaiwaneseThaiTlingit-HaidaTohono O'OdhamTonganTrinidadian and TobagonianTsimshianTurkishU.S. Virgin IslanderUgandanUkrainianUruguayanUteVenezuelanVietnameseWelshWest IndianYakamaYaquiYugoslavianYumanYup'ikZimbabwean
Immigration
NonimmigrantsImmigrantsAfghanistanAfricaAlbaniaArgentinaArmeniaAsiaAustraliaAustriaBahamasBangladeshBarbadosBelarusBelgiumBelizeBoliviaBosnia and HerzegovinaBrazilBulgariaBurma/MyanmarCabo VerdeCambodiaCameroonCanadaCaribbeanCentral AmericaChileChinaColombiaCongoCosta RicaCroatiaCubaCzechoslovakiaDenmarkDominicaDominican RepublicEastern AfricaEastern AsiaEastern EuropeEcuadorEgyptEl SalvadorEnglandEritreaEthiopiaEuropeFijiFranceGermanyGhanaGreeceGrenadaGuatemalaGuyanaHaitiHondurasHong KongHungaryIndiaIndonesiaIranIraqIrelandIsraelItalyJamaicaJapanJordanKazakhstanKenyaKoreaKuwaitLaosLatin AmericaLatviaLebanonLiberiaLithuaniaMalaysiaMexicoMicronesiaMiddle AfricaMoldovaMoroccoNepalNetherlandsNigeriaNorth AmericaNorth MacedoniaNorthern AfricaNorthern EuropeNorwayOceaniaPakistanPanamaPeruPhilippinesPolandPortugalRomaniaRussiaSaudi ArabiaScotlandSenegalSerbiaSierra LeoneSingaporeSomaliaSouth AfricaSouth AmericaSouth Central AsiaSouth Eastern AsiaSouthern EuropeSpainSri LankaSt. Vincent and the GrenadinesSudanSwedenSwitzerlandSyriaTaiwanThailandTrinidad and TobagoTurkeyUgandaUkraineUruguayUzbekistanVenezuelaVietnamWest IndiesWestern AfricaWestern AsiaWestern EuropeYemenZaireZimbabweAzores
Immigrants from Nicaragua
Race
Ancestry
AfghanAfricanAlaska NativeAlaskan AthabascanAlbanianAleutAlsatianAmericanApacheArabArapahoArgentineanArmenianAssyrian/Chaldean/SyriacAustralianAustrianBahamianBangladeshiBarbadianBasqueBelgianBelizeanBermudanBhutaneseBlackfeetBolivianBrazilianBritishBritish West IndianBulgarianBurmeseCajunCambodianCanadianCape VerdeanCarpatho RusynCelticCentral AmericanCentral American IndianCherokeeCheyenneChickasawChileanChineseChippewaChoctawColombianColvilleComancheCreeCreekCroatianCrowCubanCypriotCzechCzechoslovakianDanishDelawareDominicanDutchDutch West IndianEastern EuropeanEcuadorianEgyptianEnglishEstonianEthiopianEuropeanFijianFilipinoFinnishFrenchFrench American IndianFrench CanadianGermanGerman RussianGhanaianGreekGuamanian/ChamorroGuatemalanGuyaneseHaitianHmongHonduranHopiHoumaHungarianIcelanderIndian (Asian)IndonesianInupiatIranianIraqiIrishIroquoisIsraeliItalianJamaicanJapaneseJordanianKenyanKiowaKoreanLaotianLatvianLebaneseLiberianLithuanianLumbeeLuxembourgerMacedonianMalaysianMalteseMarshalleseMenomineeMexicanMexican American IndianMongolianMoroccanNative HawaiianNavajoNepaleseNew ZealanderNicaraguanNigerianNorthern EuropeanNorwegianOkinawanOsageOttawaPaiutePakistaniPalestinianPanamanianParaguayanPennsylvania GermanPeruvianPimaPolishPortuguesePotawatomiPuebloPuerto RicanPuget Sound SalishRomanianRussianSalvadoranSamoanScandinavianScotch-IrishScottishSeminoleSenegaleseSerbianShoshoneSierra LeoneanSiouxSlavicSlovakSloveneSomaliSouth AfricanSouth AmericanSouth American IndianSoviet UnionSpaniardSpanishSpanish AmericanSpanish American IndianSri LankanSubsaharan AfricanSudaneseSwedishSwissSyrianTaiwaneseThaiTlingit-HaidaTohono O'OdhamTonganTrinidadian and TobagonianTsimshianTurkishU.S. Virgin IslanderUgandanUkrainianUruguayanUteVenezuelanVietnameseWelshWest IndianYakamaYaquiYugoslavianYumanYup'ikZimbabwean
Immigration
NonimmigrantsImmigrantsAfghanistanAfricaAlbaniaArgentinaArmeniaAsiaAustraliaAustriaBahamasBangladeshBarbadosBelarusBelgiumBelizeBoliviaBosnia and HerzegovinaBrazilBulgariaBurma/MyanmarCabo VerdeCambodiaCameroonCanadaCaribbeanCentral AmericaChileChinaColombiaCongoCosta RicaCroatiaCubaCzechoslovakiaDenmarkDominicaDominican RepublicEastern AfricaEastern AsiaEastern EuropeEcuadorEgyptEl SalvadorEnglandEritreaEthiopiaEuropeFijiFranceGermanyGhanaGreeceGrenadaGuatemalaGuyanaHaitiHondurasHong KongHungaryIndiaIndonesiaIranIraqIrelandIsraelItalyJamaicaJapanJordanKazakhstanKenyaKoreaKuwaitLaosLatin AmericaLatviaLebanonLiberiaLithuaniaMalaysiaMexicoMicronesiaMiddle AfricaMoldovaMoroccoNepalNetherlandsNicaraguaNigeriaNorth AmericaNorth MacedoniaNorthern AfricaNorthern EuropeNorwayOceaniaPakistanPanamaPeruPhilippinesPolandPortugalRomaniaRussiaSaudi ArabiaScotlandSenegalSerbiaSierra LeoneSingaporeSomaliaSouth AfricaSouth AmericaSouth Central AsiaSouth Eastern AsiaSouthern EuropeSpainSri LankaSt. Vincent and the GrenadinesSudanSwedenSwitzerlandSyriaTaiwanThailandTrinidad and TobagoTurkeyUgandaUkraineUruguayUzbekistanVenezuelaVietnamWest IndiesWestern AfricaWestern AsiaWestern EuropeYemenZaireZimbabweAzores
Unemployment Among Ages 55 to 59 years
Income
Poverty
Unemployment
Labor Participation
Family Structure
Vehicle Availability
Education Level
Disability

Unemployment Among Ages 55 to 59 years Comparison

Costa Ricans

Immigrants from Nicaragua

Tragic
Good
5.0%
UNEMPLOYMENT AMONG AGES 55 TO 59 YEARS
4.4/ 100
METRIC RATING
225th/ 347
METRIC RANK
4.8%
UNEMPLOYMENT AMONG AGES 55 TO 59 YEARS
65.2/ 100
METRIC RATING
159th/ 347
METRIC RANK

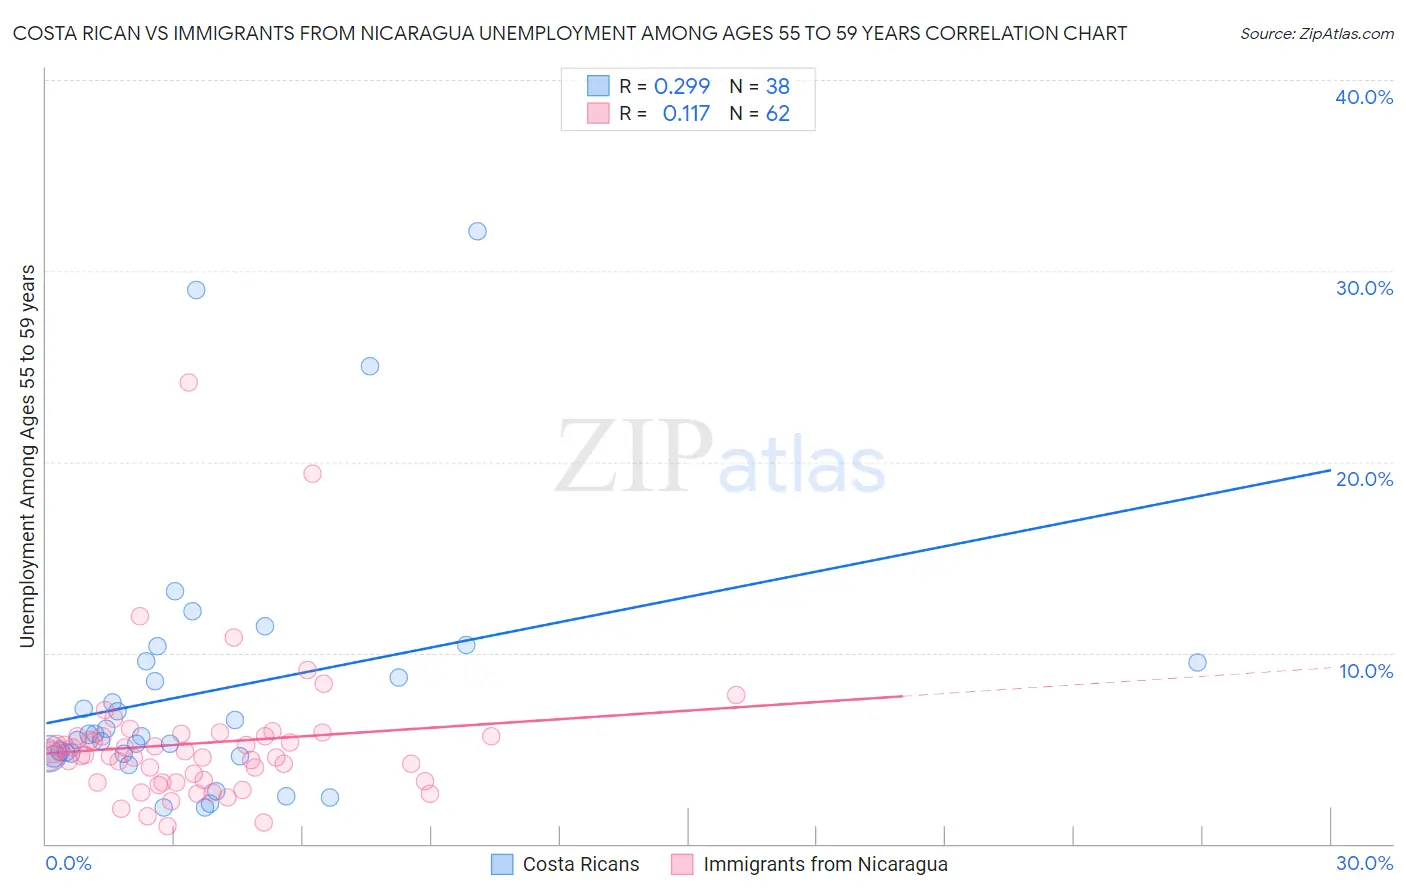
Costa Rican vs Immigrants from Nicaragua Unemployment Among Ages 55 to 59 years Correlation Chart

The statistical analysis conducted on geographies consisting of 243,507,911 people shows a weak positive correlation between the proportion of Costa Ricans and unemployment rate among population between the ages 55 and 59 in the United States with a correlation coefficient (R) of 0.299 and weighted average of 5.0%. Similarly, the statistical analysis conducted on geographies consisting of 227,237,559 people shows a poor positive correlation between the proportion of Immigrants from Nicaragua and unemployment rate among population between the ages 55 and 59 in the United States with a correlation coefficient (R) of 0.117 and weighted average of 4.8%, a difference of 3.8%.
Costa Rican vs Immigrants from Nicaragua Unemployment Among Ages 55 to 59 years

Unemployment Among Ages 55 to 59 years Correlation Summary

MeasurementCosta RicanImmigrants from Nicaragua
Minimum1.9%0.90%
Maximum32.1%24.2%
Range30.2%23.3%
Mean8.0%5.3%
Median5.7%4.6%
Interquartile 25% (IQ1)4.7%3.3%
Interquartile 75% (IQ3)9.5%5.6%
Interquartile Range (IQR)4.8%2.3%
Standard Deviation (Sample)6.8%3.7%
Standard Deviation (Population)6.7%3.6%

Similar Demographics by Unemployment Among Ages 55 to 59 years

Demographics Similar to Costa Ricans by Unemployment Among Ages 55 to 59 years

In terms of unemployment among ages 55 to 59 years, the demographic groups most similar to Costa Ricans are Subsaharan African (5.0%, a difference of 0.010%), Immigrants from China (5.0%, a difference of 0.050%), Immigrants from Ireland (5.0%, a difference of 0.090%), Spanish (5.0%, a difference of 0.15%), and Immigrants from Iran (5.0%, a difference of 0.18%).
DemographicsRating | RankUnemployment Among Ages 55 to 59 years
Immigrants | Austria
8.0
/100
|
#218
Tragic
4.9%
Immigrants | Nigeria
8.0
/100
|
#219
Tragic
4.9%
Indians (Asian)
7.6
/100
|
#220
Tragic
4.9%
Nigerians
7.5
/100
|
#221
Tragic
4.9%
Spanish
5.1
/100
|
#222
Tragic
5.0%
Immigrants | Ireland
4.8
/100
|
#223
Tragic
5.0%
Sub-Saharan Africans
4.4
/100
|
#224
Tragic
5.0%
Costa Ricans
4.4
/100
|
#225
Tragic
5.0%
Immigrants | China
4.2
/100
|
#226
Tragic
5.0%
Immigrants | Iran
3.7
/100
|
#227
Tragic
5.0%
Immigrants | Liberia
3.2
/100
|
#228
Tragic
5.0%
Immigrants | Western Asia
3.0
/100
|
#229
Tragic
5.0%
Immigrants | Syria
2.7
/100
|
#230
Tragic
5.0%
Cherokee
2.6
/100
|
#231
Tragic
5.0%
Albanians
2.5
/100
|
#232
Tragic
5.0%

Demographics Similar to Immigrants from Nicaragua by Unemployment Among Ages 55 to 59 years

In terms of unemployment among ages 55 to 59 years, the demographic groups most similar to Immigrants from Nicaragua are Chickasaw (4.8%, a difference of 0.0%), Slovak (4.8%, a difference of 0.010%), Korean (4.8%, a difference of 0.030%), Carpatho Rusyn (4.8%, a difference of 0.040%), and Immigrants from Africa (4.8%, a difference of 0.040%).
DemographicsRating | RankUnemployment Among Ages 55 to 59 years
Laotians
68.2
/100
|
#152
Good
4.8%
Immigrants | Uruguay
67.2
/100
|
#153
Good
4.8%
Immigrants | Panama
66.8
/100
|
#154
Good
4.8%
Immigrants | North Macedonia
66.3
/100
|
#155
Good
4.8%
Italians
66.2
/100
|
#156
Good
4.8%
Carpatho Rusyns
66.0
/100
|
#157
Good
4.8%
Slovaks
65.3
/100
|
#158
Good
4.8%
Immigrants | Nicaragua
65.2
/100
|
#159
Good
4.8%
Chickasaw
65.1
/100
|
#160
Good
4.8%
Koreans
64.6
/100
|
#161
Good
4.8%
Immigrants | Africa
64.2
/100
|
#162
Good
4.8%
Immigrants | Lebanon
63.8
/100
|
#163
Good
4.8%
Americans
63.3
/100
|
#164
Good
4.8%
Immigrants | France
62.0
/100
|
#165
Good
4.8%
Potawatomi
62.0
/100
|
#166
Good
4.8%