Comanche vs Tlingit-Haida Male Unemployment
COMPARE
Comanche
Tlingit-Haida
Male Unemployment
Male Unemployment Comparison
Comanche
Tlingit-Haida
5.8%
MALE UNEMPLOYMENT
0.2/ 100
METRIC RATING
256th/ 347
METRIC RANK
6.0%
MALE UNEMPLOYMENT
0.0/ 100
METRIC RATING
276th/ 347
METRIC RANK
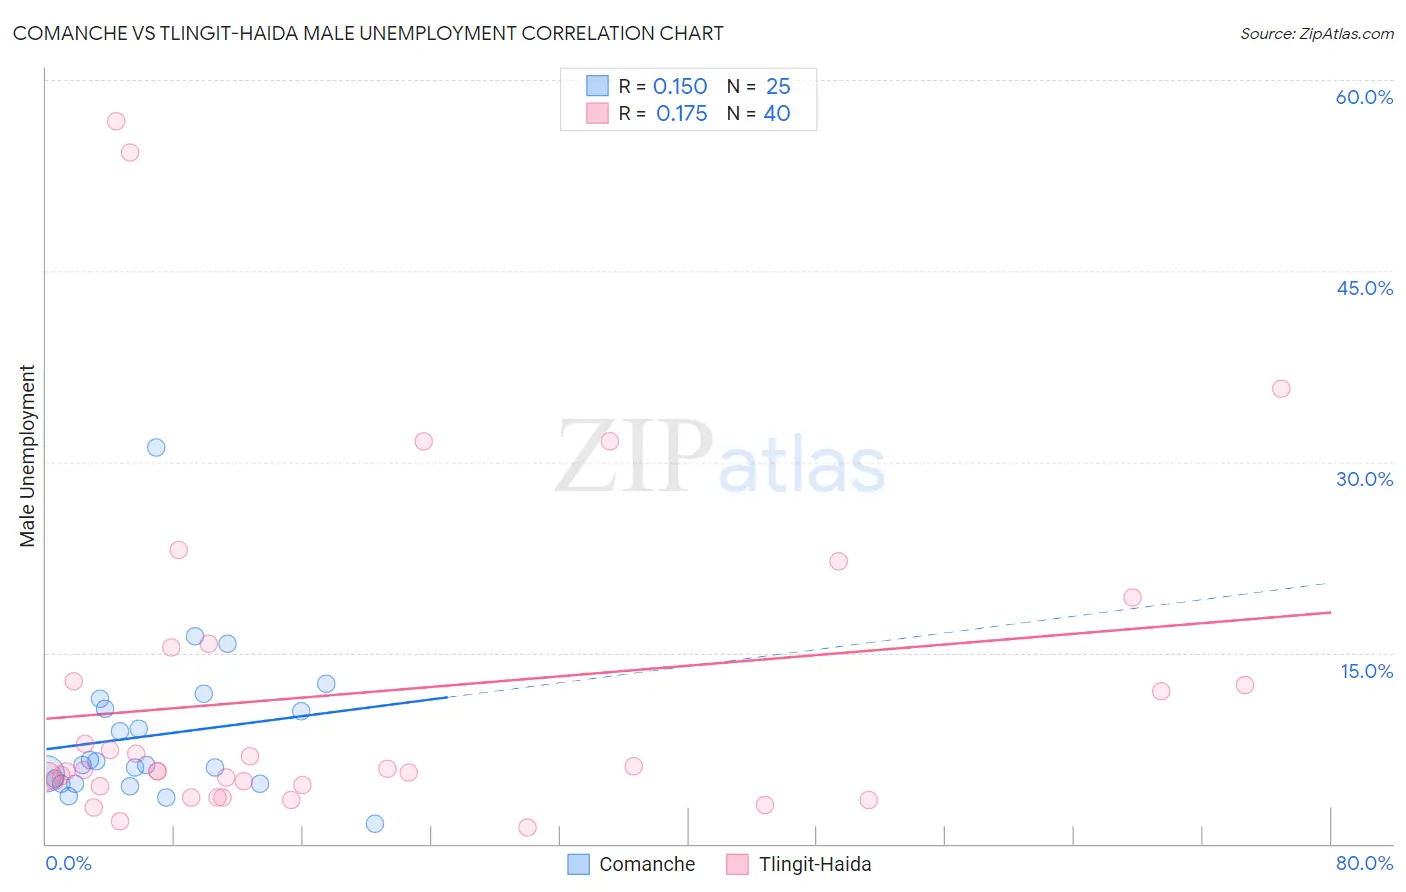
Comanche vs Tlingit-Haida Male Unemployment Correlation Chart
The statistical analysis conducted on geographies consisting of 109,543,085 people shows a poor positive correlation between the proportion of Comanche and unemployment rate among males in the United States with a correlation coefficient (R) of 0.150 and weighted average of 5.8%. Similarly, the statistical analysis conducted on geographies consisting of 60,678,234 people shows a poor positive correlation between the proportion of Tlingit-Haida and unemployment rate among males in the United States with a correlation coefficient (R) of 0.175 and weighted average of 6.0%, a difference of 4.1%.
Male Unemployment Correlation Summary
| Measurement | Comanche | Tlingit-Haida |
| Minimum | 1.6% | 1.3% |
| Maximum | 31.1% | 56.8% |
| Range | 29.5% | 55.5% |
| Mean | 8.5% | 11.9% |
| Median | 6.2% | 5.8% |
| Interquartile 25% (IQ1) | 4.7% | 4.6% |
| Interquartile 75% (IQ3) | 11.0% | 14.1% |
| Interquartile Range (IQR) | 6.3% | 9.5% |
| Standard Deviation (Sample) | 6.0% | 13.3% |
| Standard Deviation (Population) | 5.9% | 13.1% |
Demographics Similar to Comanche and Tlingit-Haida by Male Unemployment
In terms of male unemployment, the demographic groups most similar to Comanche are Hispanic or Latino (5.8%, a difference of 0.17%), Dutch West Indian (5.8%, a difference of 0.30%), Cajun (5.8%, a difference of 0.46%), Immigrants from Central America (5.8%, a difference of 0.52%), and Liberian (5.8%, a difference of 0.70%). Similarly, the demographic groups most similar to Tlingit-Haida are Menominee (6.0%, a difference of 0.10%), Immigrants from Sierra Leone (6.0%, a difference of 0.25%), Immigrants from Uzbekistan (6.0%, a difference of 0.43%), Armenian (6.0%, a difference of 0.43%), and Blackfeet (6.0%, a difference of 0.67%).
| Demographics | Rating | Rank | Male Unemployment |
| Comanche | 0.2 /100 | #256 | Tragic 5.8% |
| Hispanics or Latinos | 0.1 /100 | #257 | Tragic 5.8% |
| Dutch West Indians | 0.1 /100 | #258 | Tragic 5.8% |
| Cajuns | 0.1 /100 | #259 | Tragic 5.8% |
| Immigrants | Central America | 0.1 /100 | #260 | Tragic 5.8% |
| Liberians | 0.1 /100 | #261 | Tragic 5.8% |
| Immigrants | Portugal | 0.1 /100 | #262 | Tragic 5.9% |
| Immigrants | Latin America | 0.1 /100 | #263 | Tragic 5.9% |
| Immigrants | Mexico | 0.0 /100 | #264 | Tragic 5.9% |
| French American Indians | 0.0 /100 | #265 | Tragic 5.9% |
| Bahamians | 0.0 /100 | #266 | Tragic 5.9% |
| Nigerians | 0.0 /100 | #267 | Tragic 5.9% |
| Bermudans | 0.0 /100 | #268 | Tragic 5.9% |
| Immigrants | Nigeria | 0.0 /100 | #269 | Tragic 6.0% |
| Sub-Saharan Africans | 0.0 /100 | #270 | Tragic 6.0% |
| Blackfeet | 0.0 /100 | #271 | Tragic 6.0% |
| Immigrants | Uzbekistan | 0.0 /100 | #272 | Tragic 6.0% |
| Armenians | 0.0 /100 | #273 | Tragic 6.0% |
| Immigrants | Sierra Leone | 0.0 /100 | #274 | Tragic 6.0% |
| Menominee | 0.0 /100 | #275 | Tragic 6.0% |
| Tlingit-Haida | 0.0 /100 | #276 | Tragic 6.0% |