Chippewa vs Immigrants from Korea Unemployment Among Ages 65 to 74 years

COMPARE

Chippewa
Race
Ancestry
AfghanAfricanAlaska NativeAlaskan AthabascanAlbanianAleutAlsatianAmericanApacheArabArapahoArgentineanArmenianAssyrian/Chaldean/SyriacAustralianAustrianBahamianBangladeshiBarbadianBasqueBelgianBelizeanBermudanBhutaneseBlackfeetBolivianBrazilianBritishBritish West IndianBulgarianBurmeseCajunCambodianCanadianCape VerdeanCarpatho RusynCelticCentral AmericanCentral American IndianCherokeeCheyenneChickasawChileanChineseChippewaChoctawColombianColvilleComancheCosta RicanCreeCreekCroatianCrowCubanCypriotCzechCzechoslovakianDanishDelawareDominicanDutchDutch West IndianEastern EuropeanEcuadorianEgyptianEnglishEstonianEthiopianEuropeanFijianFilipinoFinnishFrenchFrench American IndianFrench CanadianGermanGerman RussianGhanaianGreekGuamanian/ChamorroGuatemalanGuyaneseHaitianHmongHonduranHopiHoumaHungarianIcelanderIndian (Asian)IndonesianInupiatIranianIraqiIrishIroquoisIsraeliItalianJamaicanJapaneseJordanianKenyanKiowaKoreanLaotianLatvianLebaneseLiberianLithuanianLumbeeLuxembourgerMacedonianMalaysianMalteseMarshalleseMenomineeMexicanMexican American IndianMongolianMoroccanNative HawaiianNavajoNepaleseNew ZealanderNicaraguanNigerianNorthern EuropeanNorwegianOkinawanOsageOttawaPaiutePakistaniPalestinianPanamanianParaguayanPennsylvania GermanPeruvianPimaPolishPortuguesePotawatomiPuebloPuerto RicanPuget Sound SalishRomanianRussianSalvadoranSamoanScandinavianScotch-IrishScottishSeminoleSenegaleseSerbianShoshoneSierra LeoneanSiouxSlavicSlovakSloveneSomaliSouth AfricanSouth AmericanSouth American IndianSoviet UnionSpaniardSpanishSpanish AmericanSpanish American IndianSri LankanSubsaharan AfricanSudaneseSwedishSwissSyrianTaiwaneseThaiTlingit-HaidaTohono O'OdhamTonganTrinidadian and TobagonianTsimshianTurkishU.S. Virgin IslanderUgandanUkrainianUruguayanUteVenezuelanVietnameseWelshWest IndianYakamaYaquiYugoslavianYumanYup'ikZimbabwean
Immigration
NonimmigrantsImmigrantsAfghanistanAfricaAlbaniaArgentinaArmeniaAsiaAustraliaAustriaBahamasBangladeshBarbadosBelarusBelgiumBelizeBoliviaBosnia and HerzegovinaBrazilBulgariaBurma/MyanmarCabo VerdeCambodiaCameroonCanadaCaribbeanCentral AmericaChileChinaColombiaCongoCosta RicaCroatiaCubaCzechoslovakiaDenmarkDominicaDominican RepublicEastern AfricaEastern AsiaEastern EuropeEcuadorEgyptEl SalvadorEnglandEritreaEthiopiaEuropeFijiFranceGermanyGhanaGreeceGrenadaGuatemalaGuyanaHaitiHondurasHong KongHungaryIndiaIndonesiaIranIraqIrelandIsraelItalyJamaicaJapanJordanKazakhstanKenyaKuwaitLaosLatin AmericaLatviaLebanonLiberiaLithuaniaMalaysiaMexicoMicronesiaMiddle AfricaMoldovaMoroccoNepalNetherlandsNicaraguaNigeriaNorth AmericaNorth MacedoniaNorthern AfricaNorthern EuropeNorwayOceaniaPakistanPanamaPeruPhilippinesPolandPortugalRomaniaRussiaSaudi ArabiaScotlandSenegalSerbiaSierra LeoneSingaporeSomaliaSouth AfricaSouth AmericaSouth Central AsiaSouth Eastern AsiaSouthern EuropeSpainSri LankaSt. Vincent and the GrenadinesSudanSwedenSwitzerlandSyriaTaiwanThailandTrinidad and TobagoTurkeyUgandaUkraineUruguayUzbekistanVenezuelaVietnamWest IndiesWestern AfricaWestern AsiaWestern EuropeYemenZaireZimbabweAzores
Immigrants from Korea
Race
Ancestry
AfghanAfricanAlaska NativeAlaskan AthabascanAlbanianAleutAlsatianAmericanApacheArabArapahoArgentineanArmenianAssyrian/Chaldean/SyriacAustralianAustrianBahamianBangladeshiBarbadianBasqueBelgianBelizeanBermudanBhutaneseBlackfeetBolivianBrazilianBritishBritish West IndianBulgarianBurmeseCajunCambodianCanadianCape VerdeanCarpatho RusynCelticCentral AmericanCentral American IndianCherokeeCheyenneChickasawChileanChineseChoctawColombianColvilleComancheCosta RicanCreeCreekCroatianCrowCubanCypriotCzechCzechoslovakianDanishDelawareDominicanDutchDutch West IndianEastern EuropeanEcuadorianEgyptianEnglishEstonianEthiopianEuropeanFijianFilipinoFinnishFrenchFrench American IndianFrench CanadianGermanGerman RussianGhanaianGreekGuamanian/ChamorroGuatemalanGuyaneseHaitianHmongHonduranHopiHoumaHungarianIcelanderIndian (Asian)IndonesianInupiatIranianIraqiIrishIroquoisIsraeliItalianJamaicanJapaneseJordanianKenyanKiowaKoreanLaotianLatvianLebaneseLiberianLithuanianLumbeeLuxembourgerMacedonianMalaysianMalteseMarshalleseMenomineeMexicanMexican American IndianMongolianMoroccanNative HawaiianNavajoNepaleseNew ZealanderNicaraguanNigerianNorthern EuropeanNorwegianOkinawanOsageOttawaPaiutePakistaniPalestinianPanamanianParaguayanPennsylvania GermanPeruvianPimaPolishPortuguesePotawatomiPuebloPuerto RicanPuget Sound SalishRomanianRussianSalvadoranSamoanScandinavianScotch-IrishScottishSeminoleSenegaleseSerbianShoshoneSierra LeoneanSiouxSlavicSlovakSloveneSomaliSouth AfricanSouth AmericanSouth American IndianSoviet UnionSpaniardSpanishSpanish AmericanSpanish American IndianSri LankanSubsaharan AfricanSudaneseSwedishSwissSyrianTaiwaneseThaiTlingit-HaidaTohono O'OdhamTonganTrinidadian and TobagonianTsimshianTurkishU.S. Virgin IslanderUgandanUkrainianUruguayanUteVenezuelanVietnameseWelshWest IndianYakamaYaquiYugoslavianYumanYup'ikZimbabwean
Immigration
NonimmigrantsImmigrantsAfghanistanAfricaAlbaniaArgentinaArmeniaAsiaAustraliaAustriaBahamasBangladeshBarbadosBelarusBelgiumBelizeBoliviaBosnia and HerzegovinaBrazilBulgariaBurma/MyanmarCabo VerdeCambodiaCameroonCanadaCaribbeanCentral AmericaChileChinaColombiaCongoCosta RicaCroatiaCubaCzechoslovakiaDenmarkDominicaDominican RepublicEastern AfricaEastern AsiaEastern EuropeEcuadorEgyptEl SalvadorEnglandEritreaEthiopiaEuropeFijiFranceGermanyGhanaGreeceGrenadaGuatemalaGuyanaHaitiHondurasHong KongHungaryIndiaIndonesiaIranIraqIrelandIsraelItalyJamaicaJapanJordanKazakhstanKenyaKoreaKuwaitLaosLatin AmericaLatviaLebanonLiberiaLithuaniaMalaysiaMexicoMicronesiaMiddle AfricaMoldovaMoroccoNepalNetherlandsNicaraguaNigeriaNorth AmericaNorth MacedoniaNorthern AfricaNorthern EuropeNorwayOceaniaPakistanPanamaPeruPhilippinesPolandPortugalRomaniaRussiaSaudi ArabiaScotlandSenegalSerbiaSierra LeoneSingaporeSomaliaSouth AfricaSouth AmericaSouth Central AsiaSouth Eastern AsiaSouthern EuropeSpainSri LankaSt. Vincent and the GrenadinesSudanSwedenSwitzerlandSyriaTaiwanThailandTrinidad and TobagoTurkeyUgandaUkraineUruguayUzbekistanVenezuelaVietnamWest IndiesWestern AfricaWestern AsiaWestern EuropeYemenZaireZimbabweAzores
Unemployment Among Ages 65 to 74 years
Income
Poverty
Unemployment
Labor Participation
Family Structure
Vehicle Availability
Education Level
Disability

Unemployment Among Ages 65 to 74 years Comparison

Chippewa

Immigrants from Korea

Tragic
Exceptional
5.7%
UNEMPLOYMENT AMONG AGES 65 TO 74 YEARS
0.1/ 100
METRIC RATING
284th/ 347
METRIC RANK
5.3%
UNEMPLOYMENT AMONG AGES 65 TO 74 YEARS
90.2/ 100
METRIC RATING
117th/ 347
METRIC RANK

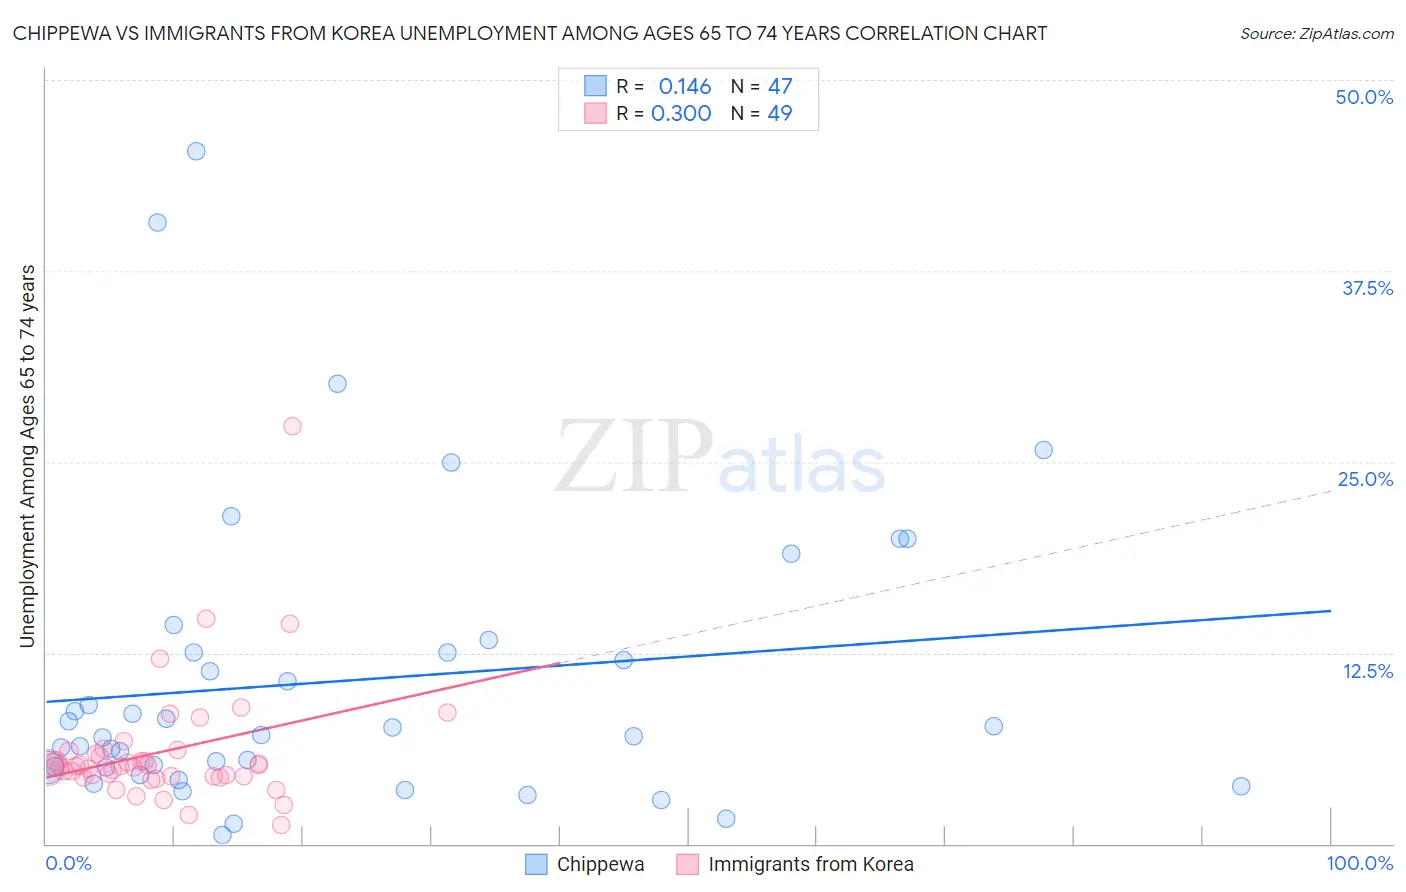
Chippewa vs Immigrants from Korea Unemployment Among Ages 65 to 74 years Correlation Chart

The statistical analysis conducted on geographies consisting of 190,997,990 people shows a poor positive correlation between the proportion of Chippewa and unemployment rate among population between the ages 65 and 74 in the United States with a correlation coefficient (R) of 0.146 and weighted average of 5.7%. Similarly, the statistical analysis conducted on geographies consisting of 363,441,575 people shows a weak positive correlation between the proportion of Immigrants from Korea and unemployment rate among population between the ages 65 and 74 in the United States with a correlation coefficient (R) of 0.300 and weighted average of 5.3%, a difference of 8.2%.
Chippewa vs Immigrants from Korea Unemployment Among Ages 65 to 74 years

Unemployment Among Ages 65 to 74 years Correlation Summary

MeasurementChippewaImmigrants from Korea
Minimum0.60%1.2%
Maximum45.3%27.3%
Range44.7%26.1%
Mean10.7%6.0%
Median7.1%5.1%
Interquartile 25% (IQ1)5.0%4.4%
Interquartile 75% (IQ3)12.5%6.0%
Interquartile Range (IQR)7.5%1.6%
Standard Deviation (Sample)9.7%4.1%
Standard Deviation (Population)9.6%4.0%

Similar Demographics by Unemployment Among Ages 65 to 74 years

Demographics Similar to Chippewa by Unemployment Among Ages 65 to 74 years

In terms of unemployment among ages 65 to 74 years, the demographic groups most similar to Chippewa are Cypriot (5.7%, a difference of 0.010%), Ottawa (5.7%, a difference of 0.040%), Immigrants from Sierra Leone (5.7%, a difference of 0.050%), Immigrants from West Indies (5.7%, a difference of 0.080%), and Marshallese (5.7%, a difference of 0.080%).
DemographicsRating | RankUnemployment Among Ages 65 to 74 years
Immigrants | South America
0.1
/100
|
#277
Tragic
5.7%
Mexican American Indians
0.1
/100
|
#278
Tragic
5.7%
Immigrants | Norway
0.1
/100
|
#279
Tragic
5.7%
Moroccans
0.1
/100
|
#280
Tragic
5.7%
Immigrants | West Indies
0.1
/100
|
#281
Tragic
5.7%
Ottawa
0.1
/100
|
#282
Tragic
5.7%
Cypriots
0.1
/100
|
#283
Tragic
5.7%
Chippewa
0.1
/100
|
#284
Tragic
5.7%
Immigrants | Sierra Leone
0.1
/100
|
#285
Tragic
5.7%
Marshallese
0.1
/100
|
#286
Tragic
5.7%
Central American Indians
0.0
/100
|
#287
Tragic
5.7%
Central Americans
0.0
/100
|
#288
Tragic
5.7%
Immigrants | Somalia
0.0
/100
|
#289
Tragic
5.7%
Spanish American Indians
0.0
/100
|
#290
Tragic
5.7%
Portuguese
0.0
/100
|
#291
Tragic
5.7%

Demographics Similar to Immigrants from Korea by Unemployment Among Ages 65 to 74 years

In terms of unemployment among ages 65 to 74 years, the demographic groups most similar to Immigrants from Korea are Immigrants from Belarus (5.3%, a difference of 0.010%), Australian (5.3%, a difference of 0.020%), Immigrants from Fiji (5.3%, a difference of 0.030%), Immigrants from Switzerland (5.3%, a difference of 0.030%), and Immigrants from Turkey (5.3%, a difference of 0.060%).
DemographicsRating | RankUnemployment Among Ages 65 to 74 years
Immigrants | Bolivia
93.6
/100
|
#110
Exceptional
5.2%
Sri Lankans
92.7
/100
|
#111
Exceptional
5.3%
Immigrants | South Central Asia
92.4
/100
|
#112
Exceptional
5.3%
Immigrants | Germany
91.6
/100
|
#113
Exceptional
5.3%
Asians
91.1
/100
|
#114
Exceptional
5.3%
Immigrants | Turkey
90.8
/100
|
#115
Exceptional
5.3%
Australians
90.4
/100
|
#116
Exceptional
5.3%
Immigrants | Korea
90.2
/100
|
#117
Exceptional
5.3%
Immigrants | Belarus
90.1
/100
|
#118
Exceptional
5.3%
Immigrants | Fiji
89.9
/100
|
#119
Excellent
5.3%
Immigrants | Switzerland
89.9
/100
|
#120
Excellent
5.3%
Immigrants | Australia
89.1
/100
|
#121
Excellent
5.3%
Immigrants | Canada
89.0
/100
|
#122
Excellent
5.3%
Czechoslovakians
88.6
/100
|
#123
Excellent
5.3%
Immigrants | Ukraine
87.5
/100
|
#124
Excellent
5.3%