Chilean vs Immigrants from England Unemployment Among Ages 16 to 19 years

COMPARE

Chilean
Race
Ancestry
AfghanAfricanAlaska NativeAlaskan AthabascanAlbanianAleutAlsatianAmericanApacheArabArapahoArgentineanArmenianAssyrian/Chaldean/SyriacAustralianAustrianBahamianBangladeshiBarbadianBasqueBelgianBelizeanBermudanBhutaneseBlackfeetBolivianBrazilianBritishBritish West IndianBulgarianBurmeseCajunCambodianCanadianCape VerdeanCarpatho RusynCelticCentral AmericanCentral American IndianCherokeeCheyenneChickasawChileanChineseChippewaChoctawColombianColvilleComancheCosta RicanCreeCreekCroatianCrowCubanCypriotCzechCzechoslovakianDanishDelawareDominicanDutchDutch West IndianEastern EuropeanEcuadorianEgyptianEnglishEstonianEthiopianEuropeanFijianFilipinoFinnishFrenchFrench American IndianFrench CanadianGermanGerman RussianGhanaianGreekGuamanian/ChamorroGuatemalanGuyaneseHaitianHmongHonduranHopiHoumaHungarianIcelanderIndian (Asian)IndonesianInupiatIranianIraqiIrishIroquoisIsraeliItalianJamaicanJapaneseJordanianKenyanKiowaKoreanLaotianLatvianLebaneseLiberianLithuanianLumbeeLuxembourgerMacedonianMalaysianMalteseMarshalleseMenomineeMexicanMexican American IndianMongolianMoroccanNative HawaiianNavajoNepaleseNew ZealanderNicaraguanNigerianNorthern EuropeanNorwegianOkinawanOsageOttawaPaiutePakistaniPalestinianPanamanianParaguayanPennsylvania GermanPeruvianPimaPolishPortuguesePotawatomiPuebloPuerto RicanPuget Sound SalishRomanianRussianSalvadoranSamoanScandinavianScotch-IrishScottishSeminoleSenegaleseSerbianShoshoneSierra LeoneanSiouxSlavicSlovakSloveneSomaliSouth AfricanSouth AmericanSouth American IndianSoviet UnionSpaniardSpanishSpanish AmericanSpanish American IndianSri LankanSubsaharan AfricanSudaneseSwedishSwissSyrianTaiwaneseThaiTlingit-HaidaTohono O'OdhamTonganTrinidadian and TobagonianTsimshianTurkishU.S. Virgin IslanderUgandanUkrainianUruguayanUteVenezuelanVietnameseWelshWest IndianYakamaYaquiYugoslavianYumanYup'ikZimbabwean
Immigration
NonimmigrantsImmigrantsAfghanistanAfricaAlbaniaArgentinaArmeniaAsiaAustraliaAustriaBahamasBangladeshBarbadosBelarusBelgiumBelizeBoliviaBosnia and HerzegovinaBrazilBulgariaBurma/MyanmarCabo VerdeCambodiaCameroonCanadaCaribbeanCentral AmericaChileChinaColombiaCongoCosta RicaCroatiaCubaCzechoslovakiaDenmarkDominicaDominican RepublicEastern AfricaEastern AsiaEastern EuropeEcuadorEgyptEl SalvadorEritreaEthiopiaEuropeFijiFranceGermanyGhanaGreeceGrenadaGuatemalaGuyanaHaitiHondurasHong KongHungaryIndiaIndonesiaIranIraqIrelandIsraelItalyJamaicaJapanJordanKazakhstanKenyaKoreaKuwaitLaosLatin AmericaLatviaLebanonLiberiaLithuaniaMalaysiaMexicoMicronesiaMiddle AfricaMoldovaMoroccoNepalNetherlandsNicaraguaNigeriaNorth AmericaNorth MacedoniaNorthern AfricaNorthern EuropeNorwayOceaniaPakistanPanamaPeruPhilippinesPolandPortugalRomaniaRussiaSaudi ArabiaScotlandSenegalSerbiaSierra LeoneSingaporeSomaliaSouth AfricaSouth AmericaSouth Central AsiaSouth Eastern AsiaSouthern EuropeSpainSri LankaSt. Vincent and the GrenadinesSudanSwedenSwitzerlandSyriaTaiwanThailandTrinidad and TobagoTurkeyUgandaUkraineUruguayUzbekistanVenezuelaVietnamWest IndiesWestern AfricaWestern AsiaWestern EuropeYemenZaireZimbabweAzores
Immigrants from England
Race
Ancestry
AfghanAfricanAlaska NativeAlaskan AthabascanAlbanianAleutAlsatianAmericanApacheArabArapahoArgentineanArmenianAssyrian/Chaldean/SyriacAustralianAustrianBahamianBangladeshiBarbadianBasqueBelgianBelizeanBermudanBhutaneseBlackfeetBolivianBrazilianBritishBritish West IndianBulgarianBurmeseCajunCambodianCanadianCape VerdeanCarpatho RusynCelticCentral AmericanCentral American IndianCherokeeCheyenneChickasawChineseChippewaChoctawColombianColvilleComancheCosta RicanCreeCreekCroatianCrowCubanCypriotCzechCzechoslovakianDanishDelawareDominicanDutchDutch West IndianEastern EuropeanEcuadorianEgyptianEnglishEstonianEthiopianEuropeanFijianFilipinoFinnishFrenchFrench American IndianFrench CanadianGermanGerman RussianGhanaianGreekGuamanian/ChamorroGuatemalanGuyaneseHaitianHmongHonduranHopiHoumaHungarianIcelanderIndian (Asian)IndonesianInupiatIranianIraqiIrishIroquoisIsraeliItalianJamaicanJapaneseJordanianKenyanKiowaKoreanLaotianLatvianLebaneseLiberianLithuanianLumbeeLuxembourgerMacedonianMalaysianMalteseMarshalleseMenomineeMexicanMexican American IndianMongolianMoroccanNative HawaiianNavajoNepaleseNew ZealanderNicaraguanNigerianNorthern EuropeanNorwegianOkinawanOsageOttawaPaiutePakistaniPalestinianPanamanianParaguayanPennsylvania GermanPeruvianPimaPolishPortuguesePotawatomiPuebloPuerto RicanPuget Sound SalishRomanianRussianSalvadoranSamoanScandinavianScotch-IrishScottishSeminoleSenegaleseSerbianShoshoneSierra LeoneanSiouxSlavicSlovakSloveneSomaliSouth AfricanSouth AmericanSouth American IndianSoviet UnionSpaniardSpanishSpanish AmericanSpanish American IndianSri LankanSubsaharan AfricanSudaneseSwedishSwissSyrianTaiwaneseThaiTlingit-HaidaTohono O'OdhamTonganTrinidadian and TobagonianTsimshianTurkishU.S. Virgin IslanderUgandanUkrainianUruguayanUteVenezuelanVietnameseWelshWest IndianYakamaYaquiYugoslavianYumanYup'ikZimbabwean
Immigration
NonimmigrantsImmigrantsAfghanistanAfricaAlbaniaArgentinaArmeniaAsiaAustraliaAustriaBahamasBangladeshBarbadosBelarusBelgiumBelizeBoliviaBosnia and HerzegovinaBrazilBulgariaBurma/MyanmarCabo VerdeCambodiaCameroonCanadaCaribbeanCentral AmericaChileChinaColombiaCongoCosta RicaCroatiaCubaCzechoslovakiaDenmarkDominicaDominican RepublicEastern AfricaEastern AsiaEastern EuropeEcuadorEgyptEl SalvadorEnglandEritreaEthiopiaEuropeFijiFranceGermanyGhanaGreeceGrenadaGuatemalaGuyanaHaitiHondurasHong KongHungaryIndiaIndonesiaIranIraqIrelandIsraelItalyJamaicaJapanJordanKazakhstanKenyaKoreaKuwaitLaosLatin AmericaLatviaLebanonLiberiaLithuaniaMalaysiaMexicoMicronesiaMiddle AfricaMoldovaMoroccoNepalNetherlandsNicaraguaNigeriaNorth AmericaNorth MacedoniaNorthern AfricaNorthern EuropeNorwayOceaniaPakistanPanamaPeruPhilippinesPolandPortugalRomaniaRussiaSaudi ArabiaScotlandSenegalSerbiaSierra LeoneSingaporeSomaliaSouth AfricaSouth AmericaSouth Central AsiaSouth Eastern AsiaSouthern EuropeSpainSri LankaSt. Vincent and the GrenadinesSudanSwedenSwitzerlandSyriaTaiwanThailandTrinidad and TobagoTurkeyUgandaUkraineUruguayUzbekistanVenezuelaVietnamWest IndiesWestern AfricaWestern AsiaWestern EuropeYemenZaireZimbabweAzores
Unemployment Among Ages 16 to 19 years
Income
Poverty
Unemployment
Labor Participation
Family Structure
Vehicle Availability
Education Level
Disability

Unemployment Among Ages 16 to 19 years Comparison

Chileans

Immigrants from England

Average
Good
17.6%
UNEMPLOYMENT AMONG AGES 16 TO 19 YEARS
50.8/ 100
METRIC RATING
173rd/ 347
METRIC RANK
17.3%
UNEMPLOYMENT AMONG AGES 16 TO 19 YEARS
78.9/ 100
METRIC RATING
144th/ 347
METRIC RANK

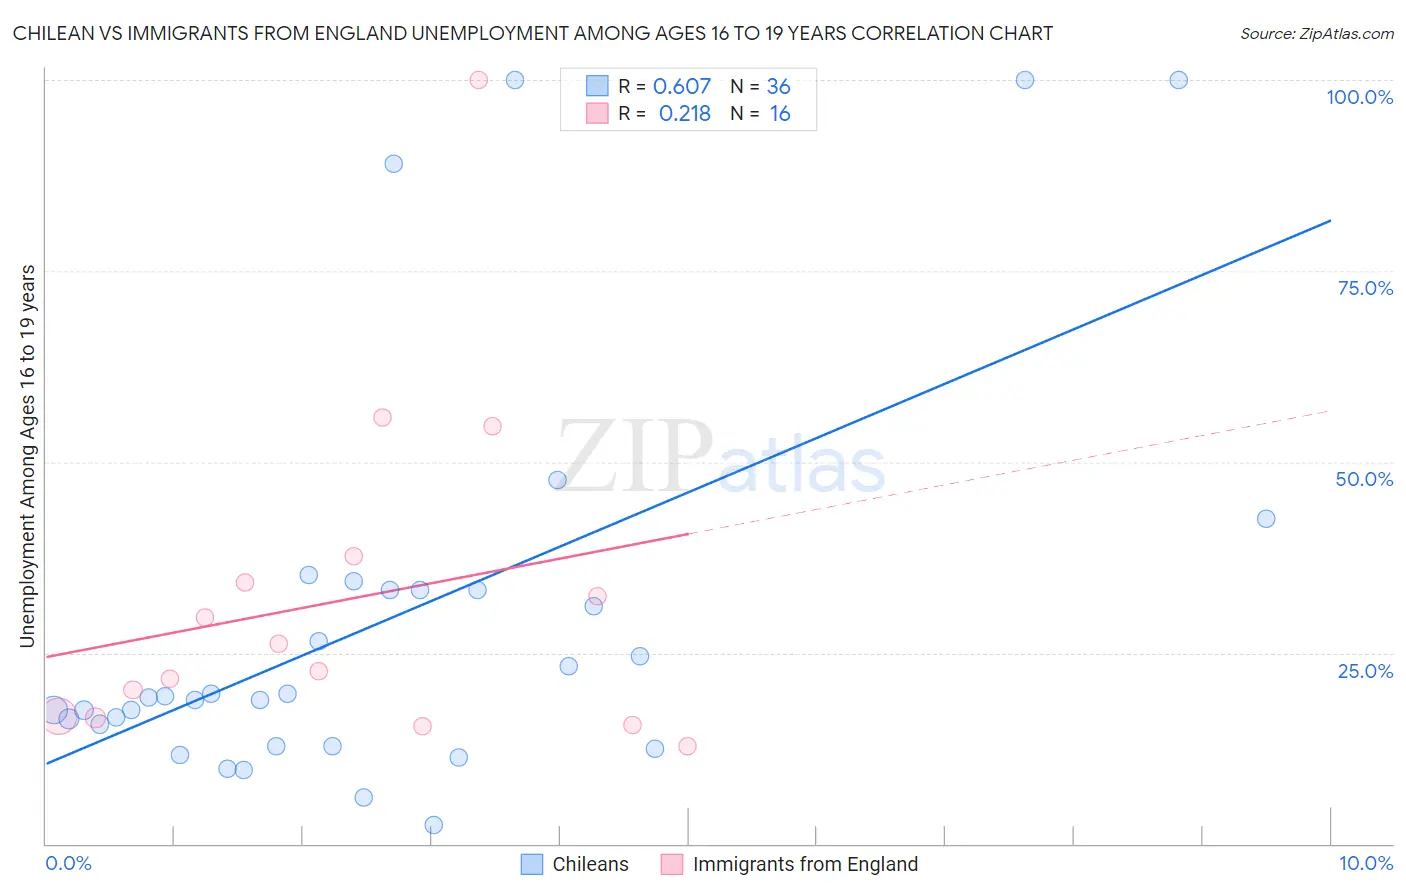
Chilean vs Immigrants from England Unemployment Among Ages 16 to 19 years Correlation Chart

The statistical analysis conducted on geographies consisting of 248,696,399 people shows a significant positive correlation between the proportion of Chileans and unemployment rate among population between the ages 16 and 19 in the United States with a correlation coefficient (R) of 0.607 and weighted average of 17.6%. Similarly, the statistical analysis conducted on geographies consisting of 370,142,514 people shows a weak positive correlation between the proportion of Immigrants from England and unemployment rate among population between the ages 16 and 19 in the United States with a correlation coefficient (R) of 0.218 and weighted average of 17.3%, a difference of 1.5%.
Chilean vs Immigrants from England Unemployment Among Ages 16 to 19 years

Unemployment Among Ages 16 to 19 years Correlation Summary

MeasurementChileanImmigrants from England
Minimum2.5%12.7%
Maximum100.0%100.0%
Range97.5%87.3%
Mean29.4%32.0%
Median19.2%24.4%
Interquartile 25% (IQ1)14.2%16.6%
Interquartile 75% (IQ3)33.3%35.9%
Interquartile Range (IQR)19.1%19.3%
Standard Deviation (Sample)26.3%22.4%
Standard Deviation (Population)26.0%21.7%

Similar Demographics by Unemployment Among Ages 16 to 19 years

Demographics Similar to Chileans by Unemployment Among Ages 16 to 19 years

In terms of unemployment among ages 16 to 19 years, the demographic groups most similar to Chileans are Osage (17.6%, a difference of 0.040%), Immigrants from Western Europe (17.6%, a difference of 0.070%), Immigrants from Sweden (17.6%, a difference of 0.080%), Nicaraguan (17.6%, a difference of 0.090%), and Bermudan (17.6%, a difference of 0.10%).
DemographicsRating | RankUnemployment Among Ages 16 to 19 years
Immigrants | Italy
55.2
/100
|
#166
Average
17.5%
Immigrants | France
54.9
/100
|
#167
Average
17.5%
Immigrants | Hungary
54.7
/100
|
#168
Average
17.5%
Immigrants | Cambodia
54.5
/100
|
#169
Average
17.5%
Immigrants | Romania
53.3
/100
|
#170
Average
17.5%
Immigrants | Switzerland
53.2
/100
|
#171
Average
17.5%
Immigrants | Western Europe
52.2
/100
|
#172
Average
17.6%
Chileans
50.8
/100
|
#173
Average
17.6%
Osage
50.0
/100
|
#174
Average
17.6%
Immigrants | Sweden
49.1
/100
|
#175
Average
17.6%
Nicaraguans
48.9
/100
|
#176
Average
17.6%
Bermudans
48.7
/100
|
#177
Average
17.6%
Celtics
48.7
/100
|
#178
Average
17.6%
Americans
47.4
/100
|
#179
Average
17.6%
Spaniards
47.1
/100
|
#180
Average
17.6%

Demographics Similar to Immigrants from England by Unemployment Among Ages 16 to 19 years

In terms of unemployment among ages 16 to 19 years, the demographic groups most similar to Immigrants from England are Immigrants from Egypt (17.3%, a difference of 0.010%), Spanish (17.3%, a difference of 0.020%), Indian (Asian) (17.3%, a difference of 0.090%), Basque (17.3%, a difference of 0.13%), and Turkish (17.3%, a difference of 0.13%).
DemographicsRating | RankUnemployment Among Ages 16 to 19 years
Immigrants | Malaysia
82.8
/100
|
#137
Excellent
17.2%
Bolivians
81.9
/100
|
#138
Excellent
17.3%
Immigrants | Eritrea
81.1
/100
|
#139
Excellent
17.3%
Immigrants | Croatia
80.8
/100
|
#140
Excellent
17.3%
Basques
80.7
/100
|
#141
Excellent
17.3%
Spanish
79.3
/100
|
#142
Good
17.3%
Immigrants | Egypt
79.1
/100
|
#143
Good
17.3%
Immigrants | England
78.9
/100
|
#144
Good
17.3%
Indians (Asian)
77.6
/100
|
#145
Good
17.3%
Turks
77.1
/100
|
#146
Good
17.3%
Tsimshian
76.0
/100
|
#147
Good
17.3%
Romanians
74.9
/100
|
#148
Good
17.3%
Immigrants | Eastern Asia
73.8
/100
|
#149
Good
17.4%
Immigrants | Northern Europe
72.5
/100
|
#150
Good
17.4%
Immigrants | Hong Kong
69.3
/100
|
#151
Good
17.4%