Cheyenne vs Shoshone Unemployment Among Ages 65 to 74 years
COMPARE
Cheyenne
Shoshone
Unemployment Among Ages 65 to 74 years
Unemployment Among Ages 65 to 74 years Comparison
Cheyenne
Shoshone
5.8%
UNEMPLOYMENT AMONG AGES 65 TO 74 YEARS
0.0/ 100
METRIC RATING
306th/ 347
METRIC RANK
6.2%
UNEMPLOYMENT AMONG AGES 65 TO 74 YEARS
0.0/ 100
METRIC RATING
327th/ 347
METRIC RANK
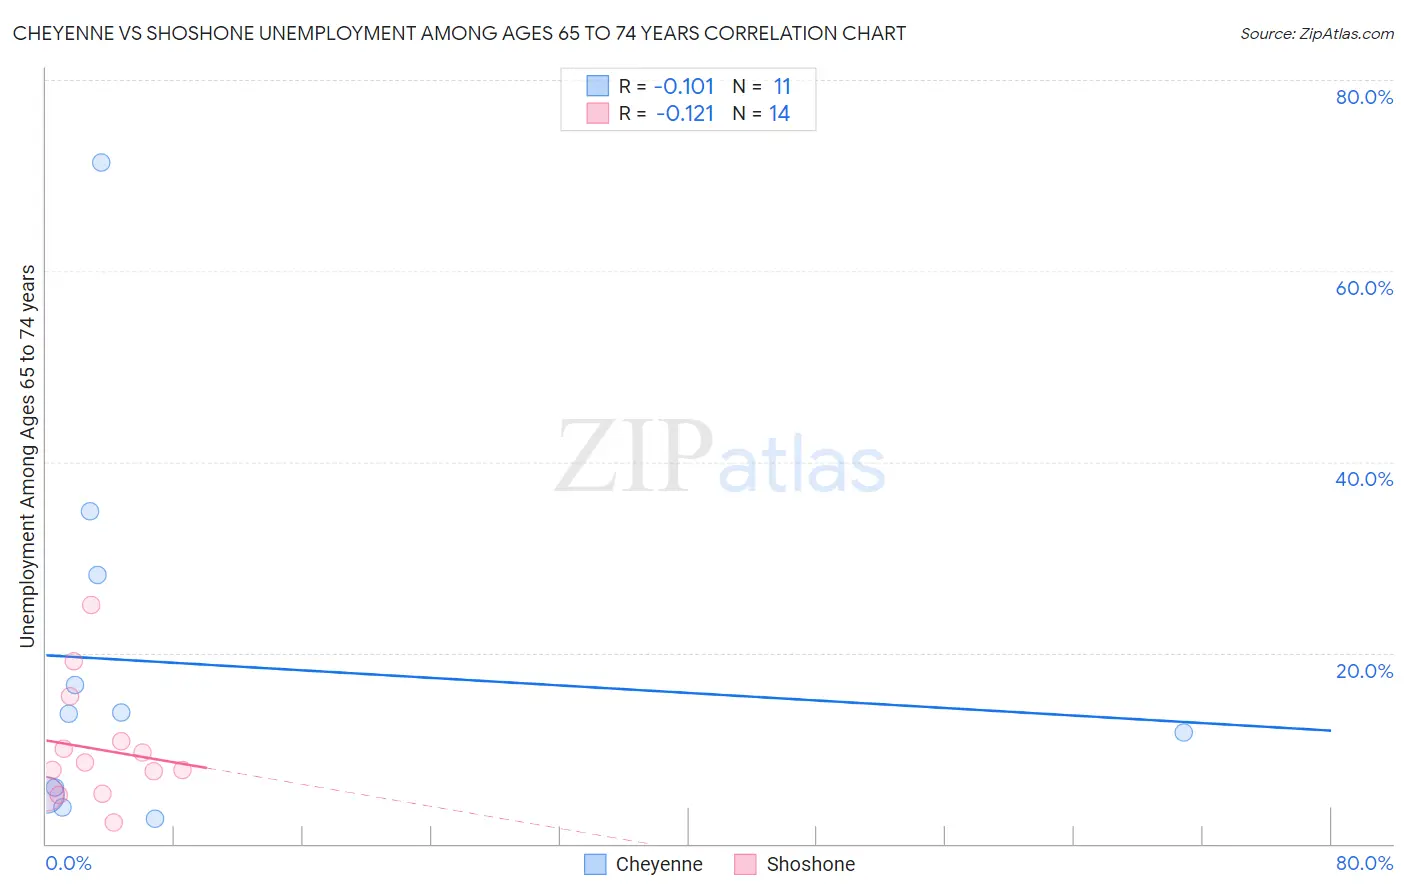
Cheyenne vs Shoshone Unemployment Among Ages 65 to 74 years Correlation Chart
The statistical analysis conducted on geographies consisting of 75,945,268 people shows a poor negative correlation between the proportion of Cheyenne and unemployment rate among population between the ages 65 and 74 in the United States with a correlation coefficient (R) of -0.101 and weighted average of 5.8%. Similarly, the statistical analysis conducted on geographies consisting of 63,179,225 people shows a poor negative correlation between the proportion of Shoshone and unemployment rate among population between the ages 65 and 74 in the United States with a correlation coefficient (R) of -0.121 and weighted average of 6.2%, a difference of 6.5%.
Unemployment Among Ages 65 to 74 years Correlation Summary
| Measurement | Cheyenne | Shoshone |
| Minimum | 2.6% | 2.2% |
| Maximum | 71.4% | 25.0% |
| Range | 68.8% | 22.8% |
| Mean | 18.9% | 9.9% |
| Median | 13.7% | 8.1% |
| Interquartile 25% (IQ1) | 5.1% | 5.2% |
| Interquartile 75% (IQ3) | 28.2% | 10.7% |
| Interquartile Range (IQR) | 23.1% | 5.5% |
| Standard Deviation (Sample) | 20.1% | 6.1% |
| Standard Deviation (Population) | 19.2% | 5.9% |
Similar Demographics by Unemployment Among Ages 65 to 74 years
Demographics Similar to Cheyenne by Unemployment Among Ages 65 to 74 years
In terms of unemployment among ages 65 to 74 years, the demographic groups most similar to Cheyenne are Mexican (5.8%, a difference of 0.0%), British West Indian (5.8%, a difference of 0.0%), Salvadoran (5.8%, a difference of 0.010%), Arapaho (5.8%, a difference of 0.020%), and Liberian (5.8%, a difference of 0.040%).
| Demographics | Rating | Rank | Unemployment Among Ages 65 to 74 years |
| Barbadians | 0.0 /100 | #299 | Tragic 5.8% |
| Ecuadorians | 0.0 /100 | #300 | Tragic 5.8% |
| Armenians | 0.0 /100 | #301 | Tragic 5.8% |
| Liberians | 0.0 /100 | #302 | Tragic 5.8% |
| Arapaho | 0.0 /100 | #303 | Tragic 5.8% |
| Salvadorans | 0.0 /100 | #304 | Tragic 5.8% |
| Mexicans | 0.0 /100 | #305 | Tragic 5.8% |
| Cheyenne | 0.0 /100 | #306 | Tragic 5.8% |
| British West Indians | 0.0 /100 | #307 | Tragic 5.8% |
| Guatemalans | 0.0 /100 | #308 | Tragic 5.8% |
| Immigrants | Ecuador | 0.0 /100 | #309 | Tragic 5.8% |
| Immigrants | Bangladesh | 0.0 /100 | #310 | Tragic 5.9% |
| Venezuelans | 0.0 /100 | #311 | Tragic 5.9% |
| Hispanics or Latinos | 0.0 /100 | #312 | Tragic 5.9% |
| Vietnamese | 0.0 /100 | #313 | Tragic 5.9% |
Demographics Similar to Shoshone by Unemployment Among Ages 65 to 74 years
In terms of unemployment among ages 65 to 74 years, the demographic groups most similar to Shoshone are Immigrants from the Azores (6.2%, a difference of 0.17%), Yuman (6.2%, a difference of 0.52%), Dominican (6.3%, a difference of 0.82%), Bermudan (6.3%, a difference of 0.97%), and Immigrants from Dominican Republic (6.3%, a difference of 1.3%).
| Demographics | Rating | Rank | Unemployment Among Ages 65 to 74 years |
| Immigrants | Bahamas | 0.0 /100 | #320 | Tragic 5.9% |
| Immigrants | Dominica | 0.0 /100 | #321 | Tragic 6.0% |
| Immigrants | Mexico | 0.0 /100 | #322 | Tragic 6.0% |
| Delaware | 0.0 /100 | #323 | Tragic 6.0% |
| Tohono O'odham | 0.0 /100 | #324 | Tragic 6.0% |
| Immigrants | Portugal | 0.0 /100 | #325 | Tragic 6.0% |
| Natives/Alaskans | 0.0 /100 | #326 | Tragic 6.0% |
| Shoshone | 0.0 /100 | #327 | Tragic 6.2% |
| Immigrants | Azores | 0.0 /100 | #328 | Tragic 6.2% |
| Yuman | 0.0 /100 | #329 | Tragic 6.2% |
| Dominicans | 0.0 /100 | #330 | Tragic 6.3% |
| Bermudans | 0.0 /100 | #331 | Tragic 6.3% |
| Immigrants | Dominican Republic | 0.0 /100 | #332 | Tragic 6.3% |
| Paiute | 0.0 /100 | #333 | Tragic 6.3% |
| Taiwanese | 0.0 /100 | #334 | Tragic 6.3% |