Cherokee vs Scotch-Irish Unemployment Among Ages 25 to 29 years

COMPARE

Cherokee
Race
Ancestry
AfghanAfricanAlaska NativeAlaskan AthabascanAlbanianAleutAlsatianAmericanApacheArabArapahoArgentineanArmenianAssyrian/Chaldean/SyriacAustralianAustrianBahamianBangladeshiBarbadianBasqueBelgianBelizeanBermudanBhutaneseBlackfeetBolivianBrazilianBritishBritish West IndianBulgarianBurmeseCajunCambodianCanadianCape VerdeanCarpatho RusynCelticCentral AmericanCentral American IndianCherokeeCheyenneChickasawChileanChineseChippewaChoctawColombianColvilleComancheCosta RicanCreeCreekCroatianCrowCubanCypriotCzechCzechoslovakianDanishDelawareDominicanDutchDutch West IndianEastern EuropeanEcuadorianEgyptianEnglishEstonianEthiopianEuropeanFijianFilipinoFinnishFrenchFrench American IndianFrench CanadianGermanGerman RussianGhanaianGreekGuamanian/ChamorroGuatemalanGuyaneseHaitianHmongHonduranHopiHoumaHungarianIcelanderIndian (Asian)IndonesianInupiatIranianIraqiIrishIroquoisIsraeliItalianJamaicanJapaneseJordanianKenyanKiowaKoreanLaotianLatvianLebaneseLiberianLithuanianLumbeeLuxembourgerMacedonianMalaysianMalteseMarshalleseMenomineeMexicanMexican American IndianMongolianMoroccanNative HawaiianNavajoNepaleseNew ZealanderNicaraguanNigerianNorthern EuropeanNorwegianOkinawanOsageOttawaPaiutePakistaniPalestinianPanamanianParaguayanPennsylvania GermanPeruvianPimaPolishPortuguesePotawatomiPuebloPuerto RicanPuget Sound SalishRomanianRussianSalvadoranSamoanScandinavianScottishSeminoleSenegaleseSerbianShoshoneSierra LeoneanSiouxSlavicSlovakSloveneSomaliSouth AfricanSouth AmericanSouth American IndianSoviet UnionSpaniardSpanishSpanish AmericanSpanish American IndianSri LankanSubsaharan AfricanSudaneseSwedishSwissSyrianTaiwaneseThaiTlingit-HaidaTohono O'OdhamTonganTrinidadian and TobagonianTsimshianTurkishU.S. Virgin IslanderUgandanUkrainianUruguayanUteVenezuelanVietnameseWelshWest IndianYakamaYaquiYugoslavianYumanYup'ikZimbabwean
Immigration
NonimmigrantsImmigrantsAfghanistanAfricaAlbaniaArgentinaArmeniaAsiaAustraliaAustriaBahamasBangladeshBarbadosBelarusBelgiumBelizeBoliviaBosnia and HerzegovinaBrazilBulgariaBurma/MyanmarCabo VerdeCambodiaCameroonCanadaCaribbeanCentral AmericaChileChinaColombiaCongoCosta RicaCroatiaCubaCzechoslovakiaDenmarkDominicaDominican RepublicEastern AfricaEastern AsiaEastern EuropeEcuadorEgyptEl SalvadorEnglandEritreaEthiopiaEuropeFijiFranceGermanyGhanaGreeceGrenadaGuatemalaGuyanaHaitiHondurasHong KongHungaryIndiaIndonesiaIranIraqIrelandIsraelItalyJamaicaJapanJordanKazakhstanKenyaKoreaKuwaitLaosLatin AmericaLatviaLebanonLiberiaLithuaniaMalaysiaMexicoMicronesiaMiddle AfricaMoldovaMoroccoNepalNetherlandsNicaraguaNigeriaNorth AmericaNorth MacedoniaNorthern AfricaNorthern EuropeNorwayOceaniaPakistanPanamaPeruPhilippinesPolandPortugalRomaniaRussiaSaudi ArabiaScotlandSenegalSerbiaSierra LeoneSingaporeSomaliaSouth AfricaSouth AmericaSouth Central AsiaSouth Eastern AsiaSouthern EuropeSpainSri LankaSt. Vincent and the GrenadinesSudanSwedenSwitzerlandSyriaTaiwanThailandTrinidad and TobagoTurkeyUgandaUkraineUruguayUzbekistanVenezuelaVietnamWest IndiesWestern AfricaWestern AsiaWestern EuropeYemenZaireZimbabweAzores
Scotch-Irish
Race
Ancestry
AfghanAfricanAlaska NativeAlaskan AthabascanAlbanianAleutAlsatianAmericanApacheArabArapahoArgentineanArmenianAssyrian/Chaldean/SyriacAustralianAustrianBahamianBangladeshiBarbadianBasqueBelgianBelizeanBermudanBhutaneseBlackfeetBolivianBrazilianBritishBritish West IndianBulgarianBurmeseCajunCambodianCanadianCape VerdeanCarpatho RusynCelticCentral AmericanCentral American IndianCheyenneChickasawChileanChineseChippewaChoctawColombianColvilleComancheCosta RicanCreeCreekCroatianCrowCubanCypriotCzechCzechoslovakianDanishDelawareDominicanDutchDutch West IndianEastern EuropeanEcuadorianEgyptianEnglishEstonianEthiopianEuropeanFijianFilipinoFinnishFrenchFrench American IndianFrench CanadianGermanGerman RussianGhanaianGreekGuamanian/ChamorroGuatemalanGuyaneseHaitianHmongHonduranHopiHoumaHungarianIcelanderIndian (Asian)IndonesianInupiatIranianIraqiIrishIroquoisIsraeliItalianJamaicanJapaneseJordanianKenyanKiowaKoreanLaotianLatvianLebaneseLiberianLithuanianLumbeeLuxembourgerMacedonianMalaysianMalteseMarshalleseMenomineeMexicanMexican American IndianMongolianMoroccanNative HawaiianNavajoNepaleseNew ZealanderNicaraguanNigerianNorthern EuropeanNorwegianOkinawanOsageOttawaPaiutePakistaniPalestinianPanamanianParaguayanPennsylvania GermanPeruvianPimaPolishPortuguesePotawatomiPuebloPuerto RicanPuget Sound SalishRomanianRussianSalvadoranSamoanScandinavianScotch-IrishScottishSeminoleSenegaleseSerbianShoshoneSierra LeoneanSiouxSlavicSlovakSloveneSomaliSouth AfricanSouth AmericanSouth American IndianSoviet UnionSpaniardSpanishSpanish AmericanSpanish American IndianSri LankanSubsaharan AfricanSudaneseSwedishSwissSyrianTaiwaneseThaiTlingit-HaidaTohono O'OdhamTonganTrinidadian and TobagonianTsimshianTurkishU.S. Virgin IslanderUgandanUkrainianUruguayanUteVenezuelanVietnameseWelshWest IndianYakamaYaquiYugoslavianYumanYup'ikZimbabwean
Immigration
NonimmigrantsImmigrantsAfghanistanAfricaAlbaniaArgentinaArmeniaAsiaAustraliaAustriaBahamasBangladeshBarbadosBelarusBelgiumBelizeBoliviaBosnia and HerzegovinaBrazilBulgariaBurma/MyanmarCabo VerdeCambodiaCameroonCanadaCaribbeanCentral AmericaChileChinaColombiaCongoCosta RicaCroatiaCubaCzechoslovakiaDenmarkDominicaDominican RepublicEastern AfricaEastern AsiaEastern EuropeEcuadorEgyptEl SalvadorEnglandEritreaEthiopiaEuropeFijiFranceGermanyGhanaGreeceGrenadaGuatemalaGuyanaHaitiHondurasHong KongHungaryIndiaIndonesiaIranIraqIrelandIsraelItalyJamaicaJapanJordanKazakhstanKenyaKoreaKuwaitLaosLatin AmericaLatviaLebanonLiberiaLithuaniaMalaysiaMexicoMicronesiaMiddle AfricaMoldovaMoroccoNepalNetherlandsNicaraguaNigeriaNorth AmericaNorth MacedoniaNorthern AfricaNorthern EuropeNorwayOceaniaPakistanPanamaPeruPhilippinesPolandPortugalRomaniaRussiaSaudi ArabiaScotlandSenegalSerbiaSierra LeoneSingaporeSomaliaSouth AfricaSouth AmericaSouth Central AsiaSouth Eastern AsiaSouthern EuropeSpainSri LankaSt. Vincent and the GrenadinesSudanSwedenSwitzerlandSyriaTaiwanThailandTrinidad and TobagoTurkeyUgandaUkraineUruguayUzbekistanVenezuelaVietnamWest IndiesWestern AfricaWestern AsiaWestern EuropeYemenZaireZimbabweAzores
Unemployment Among Ages 25 to 29 years
Income
Poverty
Unemployment
Labor Participation
Family Structure
Vehicle Availability
Education Level
Disability

Unemployment Among Ages 25 to 29 years Comparison

Cherokee

Scotch-Irish

Tragic
Poor
7.6%
UNEMPLOYMENT AMONG AGES 25 TO 29 YEARS
0.0/ 100
METRIC RATING
284th/ 347
METRIC RANK
6.8%
UNEMPLOYMENT AMONG AGES 25 TO 29 YEARS
20.0/ 100
METRIC RATING
204th/ 347
METRIC RANK

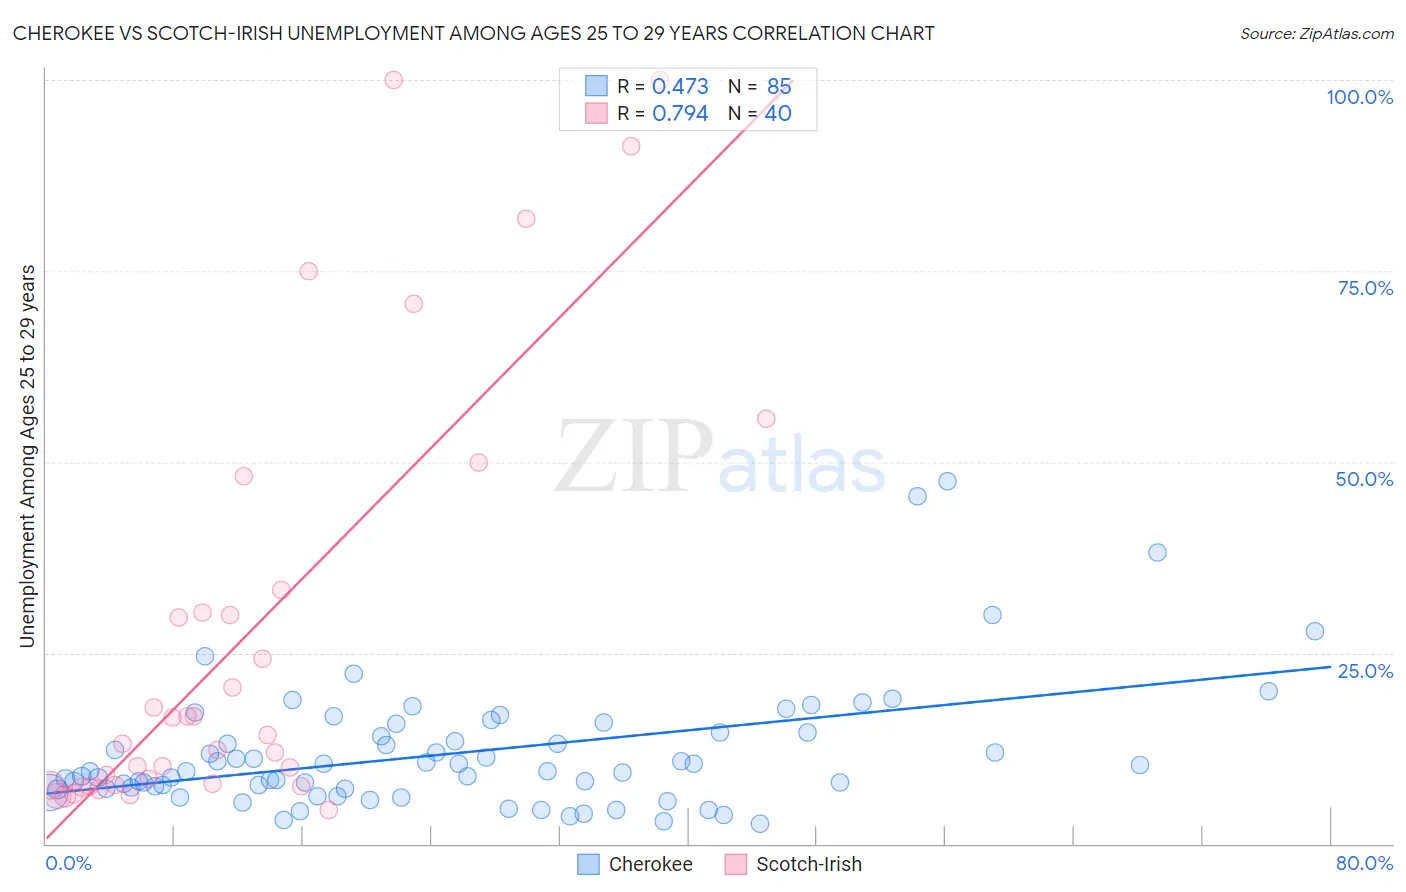
Cherokee vs Scotch-Irish Unemployment Among Ages 25 to 29 years Correlation Chart

The statistical analysis conducted on geographies consisting of 454,121,490 people shows a moderate positive correlation between the proportion of Cherokee and unemployment rate among population between the ages 25 and 29 in the United States with a correlation coefficient (R) of 0.473 and weighted average of 7.6%. Similarly, the statistical analysis conducted on geographies consisting of 489,887,362 people shows a strong positive correlation between the proportion of Scotch-Irish and unemployment rate among population between the ages 25 and 29 in the United States with a correlation coefficient (R) of 0.794 and weighted average of 6.8%, a difference of 11.5%.
Cherokee vs Scotch-Irish Unemployment Among Ages 25 to 29 years

Unemployment Among Ages 25 to 29 years Correlation Summary

MeasurementCherokeeScotch-Irish
Minimum2.7%4.5%
Maximum47.4%100.0%
Range44.7%95.5%
Mean11.9%27.2%
Median9.5%13.7%
Interquartile 25% (IQ1)7.3%7.7%
Interquartile 75% (IQ3)14.6%31.8%
Interquartile Range (IQR)7.3%24.1%
Standard Deviation (Sample)8.3%28.4%
Standard Deviation (Population)8.2%28.1%

Similar Demographics by Unemployment Among Ages 25 to 29 years

Demographics Similar to Cherokee by Unemployment Among Ages 25 to 29 years

In terms of unemployment among ages 25 to 29 years, the demographic groups most similar to Cherokee are Creek (7.6%, a difference of 0.010%), Senegalese (7.6%, a difference of 0.12%), Immigrants from Senegal (7.6%, a difference of 0.18%), Vietnamese (7.6%, a difference of 0.21%), and Immigrants from Bangladesh (7.5%, a difference of 0.35%).
DemographicsRating | RankUnemployment Among Ages 25 to 29 years
Iroquois
0.0
/100
|
#277
Tragic
7.5%
Mexicans
0.0
/100
|
#278
Tragic
7.5%
Nepalese
0.0
/100
|
#279
Tragic
7.5%
Immigrants | Caribbean
0.0
/100
|
#280
Tragic
7.5%
Immigrants | Bangladesh
0.0
/100
|
#281
Tragic
7.5%
Immigrants | Senegal
0.0
/100
|
#282
Tragic
7.6%
Creek
0.0
/100
|
#283
Tragic
7.6%
Cherokee
0.0
/100
|
#284
Tragic
7.6%
Senegalese
0.0
/100
|
#285
Tragic
7.6%
Vietnamese
0.0
/100
|
#286
Tragic
7.6%
Immigrants | Mexico
0.0
/100
|
#287
Tragic
7.6%
Africans
0.0
/100
|
#288
Tragic
7.6%
Belizeans
0.0
/100
|
#289
Tragic
7.7%
Armenians
0.0
/100
|
#290
Tragic
7.7%
Hispanics or Latinos
0.0
/100
|
#291
Tragic
7.7%

Demographics Similar to Scotch-Irish by Unemployment Among Ages 25 to 29 years

In terms of unemployment among ages 25 to 29 years, the demographic groups most similar to Scotch-Irish are Immigrants from England (6.8%, a difference of 0.010%), Ugandan (6.8%, a difference of 0.020%), Immigrants from Denmark (6.8%, a difference of 0.090%), Immigrants from Germany (6.8%, a difference of 0.11%), and Immigrants from Norway (6.8%, a difference of 0.12%).
DemographicsRating | RankUnemployment Among Ages 25 to 29 years
Italians
26.5
/100
|
#197
Fair
6.8%
Immigrants | Southern Europe
24.6
/100
|
#198
Fair
6.8%
Guamanians/Chamorros
24.3
/100
|
#199
Fair
6.8%
South American Indians
23.3
/100
|
#200
Fair
6.8%
Basques
22.5
/100
|
#201
Fair
6.8%
Immigrants | Argentina
21.6
/100
|
#202
Fair
6.8%
Immigrants | Norway
21.2
/100
|
#203
Fair
6.8%
Scotch-Irish
20.0
/100
|
#204
Poor
6.8%
Immigrants | England
19.8
/100
|
#205
Poor
6.8%
Ugandans
19.8
/100
|
#206
Poor
6.8%
Immigrants | Denmark
19.0
/100
|
#207
Poor
6.8%
Immigrants | Germany
18.8
/100
|
#208
Poor
6.8%
Hawaiians
17.1
/100
|
#209
Poor
6.8%
Canadians
16.9
/100
|
#210
Poor
6.8%
Immigrants | Philippines
16.7
/100
|
#211
Poor
6.8%