Cherokee vs Immigrants from France Unemployment Among Ages 16 to 19 years
COMPARE
Cherokee
Immigrants from France
Unemployment Among Ages 16 to 19 years
Unemployment Among Ages 16 to 19 years Comparison
Cherokee
Immigrants from France
17.9%
UNEMPLOYMENT AMONG AGES 16 TO 19 YEARS
15.7/ 100
METRIC RATING
209th/ 347
METRIC RANK
17.5%
UNEMPLOYMENT AMONG AGES 16 TO 19 YEARS
54.9/ 100
METRIC RATING
167th/ 347
METRIC RANK
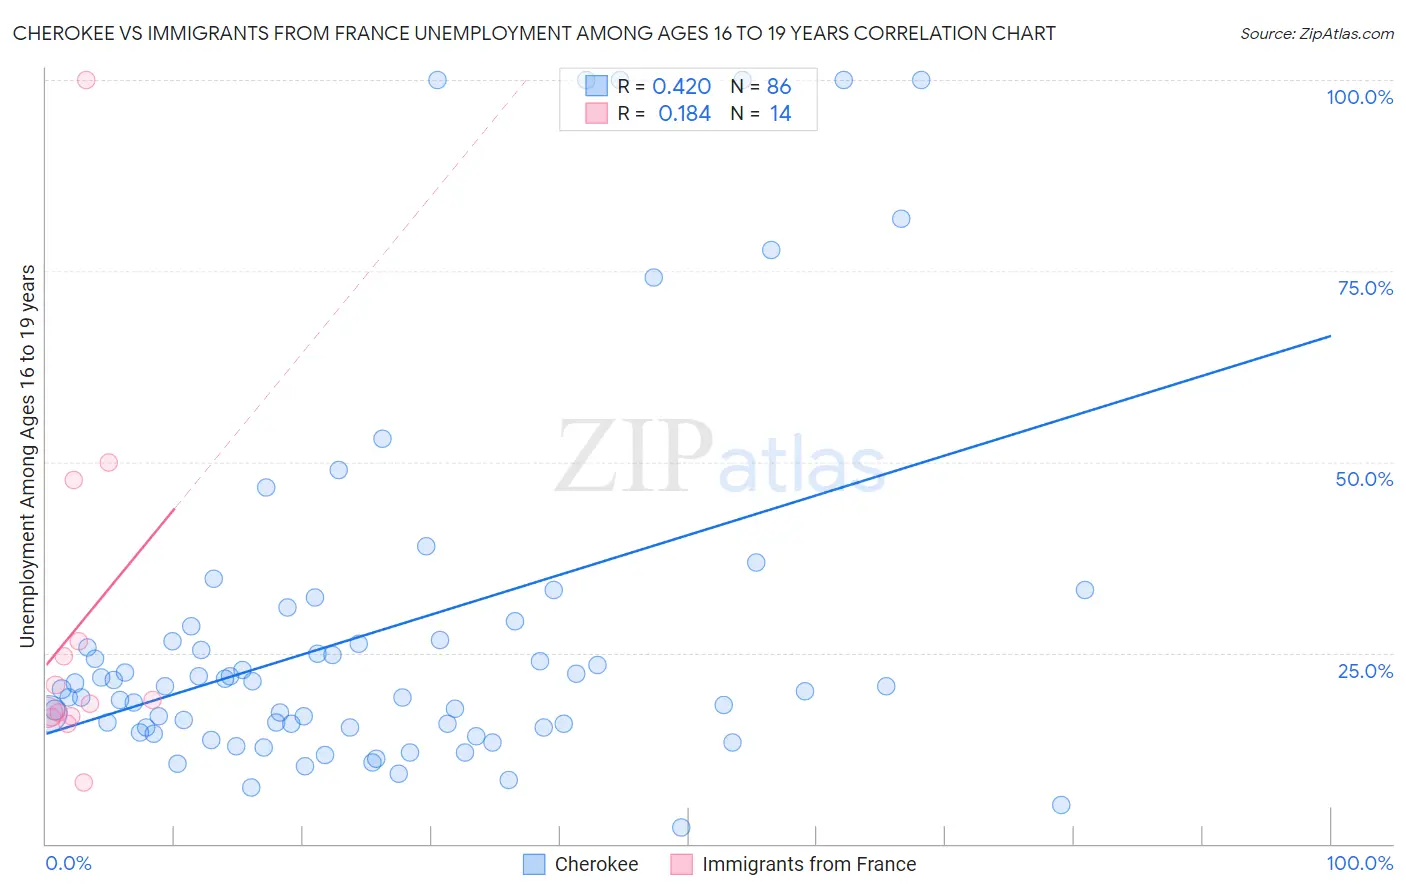
Cherokee vs Immigrants from France Unemployment Among Ages 16 to 19 years Correlation Chart
The statistical analysis conducted on geographies consisting of 455,329,369 people shows a moderate positive correlation between the proportion of Cherokee and unemployment rate among population between the ages 16 and 19 in the United States with a correlation coefficient (R) of 0.420 and weighted average of 17.9%. Similarly, the statistical analysis conducted on geographies consisting of 275,602,190 people shows a poor positive correlation between the proportion of Immigrants from France and unemployment rate among population between the ages 16 and 19 in the United States with a correlation coefficient (R) of 0.184 and weighted average of 17.5%, a difference of 2.2%.
Unemployment Among Ages 16 to 19 years Correlation Summary
| Measurement | Cherokee | Immigrants from France |
| Minimum | 2.2% | 8.0% |
| Maximum | 100.0% | 100.0% |
| Range | 97.8% | 92.0% |
| Mean | 28.0% | 28.4% |
| Median | 20.4% | 18.5% |
| Interquartile 25% (IQ1) | 15.2% | 16.7% |
| Interquartile 75% (IQ3) | 26.7% | 26.5% |
| Interquartile Range (IQR) | 11.5% | 9.8% |
| Standard Deviation (Sample) | 24.2% | 23.8% |
| Standard Deviation (Population) | 24.0% | 22.9% |
Similar Demographics by Unemployment Among Ages 16 to 19 years
Demographics Similar to Cherokee by Unemployment Among Ages 16 to 19 years
In terms of unemployment among ages 16 to 19 years, the demographic groups most similar to Cherokee are Carpatho Rusyn (17.9%, a difference of 0.010%), Hawaiian (17.9%, a difference of 0.090%), Guamanian/Chamorro (17.9%, a difference of 0.12%), Argentinean (18.0%, a difference of 0.17%), and Chippewa (18.0%, a difference of 0.18%).
| Demographics | Rating | Rank | Unemployment Among Ages 16 to 19 years |
| Immigrants | Portugal | 27.2 /100 | #202 | Fair 17.8% |
| Immigrants | Eastern Europe | 23.6 /100 | #203 | Fair 17.8% |
| Immigrants | Nonimmigrants | 20.9 /100 | #204 | Fair 17.9% |
| Assyrians/Chaldeans/Syriacs | 20.8 /100 | #205 | Fair 17.9% |
| Immigrants | Southern Europe | 18.9 /100 | #206 | Poor 17.9% |
| Liberians | 18.6 /100 | #207 | Poor 17.9% |
| Hawaiians | 16.8 /100 | #208 | Poor 17.9% |
| Cherokee | 15.7 /100 | #209 | Poor 17.9% |
| Carpatho Rusyns | 15.6 /100 | #210 | Poor 17.9% |
| Guamanians/Chamorros | 14.5 /100 | #211 | Poor 17.9% |
| Argentineans | 13.8 /100 | #212 | Poor 18.0% |
| Chippewa | 13.7 /100 | #213 | Poor 18.0% |
| Immigrants | Morocco | 13.5 /100 | #214 | Poor 18.0% |
| Immigrants | Syria | 13.3 /100 | #215 | Poor 18.0% |
| Immigrants | Kazakhstan | 13.0 /100 | #216 | Poor 18.0% |
Demographics Similar to Immigrants from France by Unemployment Among Ages 16 to 19 years
In terms of unemployment among ages 16 to 19 years, the demographic groups most similar to Immigrants from France are Immigrants from Hungary (17.5%, a difference of 0.010%), Immigrants from Italy (17.5%, a difference of 0.020%), Immigrants from Cambodia (17.5%, a difference of 0.020%), Cape Verdean (17.5%, a difference of 0.040%), and Immigrants from Romania (17.5%, a difference of 0.080%).
| Demographics | Rating | Rank | Unemployment Among Ages 16 to 19 years |
| Ukrainians | 60.5 /100 | #160 | Good 17.5% |
| Immigrants | Denmark | 60.3 /100 | #161 | Good 17.5% |
| Immigrants | Norway | 59.8 /100 | #162 | Average 17.5% |
| Egyptians | 59.7 /100 | #163 | Average 17.5% |
| Immigrants | Austria | 57.7 /100 | #164 | Average 17.5% |
| Cape Verdeans | 55.8 /100 | #165 | Average 17.5% |
| Immigrants | Italy | 55.2 /100 | #166 | Average 17.5% |
| Immigrants | France | 54.9 /100 | #167 | Average 17.5% |
| Immigrants | Hungary | 54.7 /100 | #168 | Average 17.5% |
| Immigrants | Cambodia | 54.5 /100 | #169 | Average 17.5% |
| Immigrants | Romania | 53.3 /100 | #170 | Average 17.5% |
| Immigrants | Switzerland | 53.2 /100 | #171 | Average 17.5% |
| Immigrants | Western Europe | 52.2 /100 | #172 | Average 17.6% |
| Chileans | 50.8 /100 | #173 | Average 17.6% |
| Osage | 50.0 /100 | #174 | Average 17.6% |