Central American vs Immigrants from Egypt Unemployment Among Ages 30 to 34 years

COMPARE

Central American
Race
Ancestry
AfghanAfricanAlaska NativeAlaskan AthabascanAlbanianAleutAlsatianAmericanApacheArabArapahoArgentineanArmenianAssyrian/Chaldean/SyriacAustralianAustrianBahamianBangladeshiBarbadianBasqueBelgianBelizeanBermudanBhutaneseBlackfeetBolivianBrazilianBritishBritish West IndianBulgarianBurmeseCajunCambodianCanadianCape VerdeanCarpatho RusynCelticCentral AmericanCentral American IndianCherokeeCheyenneChickasawChileanChineseChippewaChoctawColombianColvilleComancheCosta RicanCreeCreekCroatianCrowCubanCypriotCzechCzechoslovakianDanishDelawareDominicanDutchDutch West IndianEastern EuropeanEcuadorianEgyptianEnglishEstonianEthiopianEuropeanFijianFilipinoFinnishFrenchFrench American IndianFrench CanadianGermanGerman RussianGhanaianGreekGuamanian/ChamorroGuatemalanGuyaneseHaitianHmongHonduranHopiHoumaHungarianIcelanderIndian (Asian)IndonesianInupiatIranianIraqiIrishIroquoisIsraeliItalianJamaicanJapaneseJordanianKenyanKiowaKoreanLaotianLatvianLebaneseLiberianLithuanianLumbeeLuxembourgerMacedonianMalaysianMalteseMarshalleseMenomineeMexicanMexican American IndianMongolianMoroccanNative HawaiianNavajoNepaleseNew ZealanderNicaraguanNigerianNorthern EuropeanNorwegianOkinawanOsageOttawaPaiutePakistaniPalestinianPanamanianParaguayanPennsylvania GermanPeruvianPimaPolishPortuguesePotawatomiPuebloPuerto RicanPuget Sound SalishRomanianRussianSalvadoranSamoanScandinavianScotch-IrishScottishSeminoleSenegaleseSerbianShoshoneSierra LeoneanSiouxSlavicSlovakSloveneSomaliSouth AfricanSouth AmericanSouth American IndianSoviet UnionSpaniardSpanishSpanish AmericanSpanish American IndianSri LankanSubsaharan AfricanSudaneseSwedishSwissSyrianTaiwaneseThaiTlingit-HaidaTohono O'OdhamTonganTrinidadian and TobagonianTsimshianTurkishU.S. Virgin IslanderUgandanUkrainianUruguayanUteVenezuelanVietnameseWelshWest IndianYakamaYaquiYugoslavianYumanYup'ikZimbabwean
Immigration
NonimmigrantsImmigrantsAfghanistanAfricaAlbaniaArgentinaArmeniaAsiaAustraliaAustriaBahamasBangladeshBarbadosBelarusBelgiumBelizeBoliviaBosnia and HerzegovinaBrazilBulgariaBurma/MyanmarCabo VerdeCambodiaCameroonCanadaCaribbeanCentral AmericaChileChinaColombiaCongoCosta RicaCroatiaCubaCzechoslovakiaDenmarkDominicaDominican RepublicEastern AfricaEastern AsiaEastern EuropeEcuadorEl SalvadorEnglandEritreaEthiopiaEuropeFijiFranceGermanyGhanaGreeceGrenadaGuatemalaGuyanaHaitiHondurasHong KongHungaryIndiaIndonesiaIranIraqIrelandIsraelItalyJamaicaJapanJordanKazakhstanKenyaKoreaKuwaitLaosLatin AmericaLatviaLebanonLiberiaLithuaniaMalaysiaMexicoMicronesiaMiddle AfricaMoldovaMoroccoNepalNetherlandsNicaraguaNigeriaNorth AmericaNorth MacedoniaNorthern AfricaNorthern EuropeNorwayOceaniaPakistanPanamaPeruPhilippinesPolandPortugalRomaniaRussiaSaudi ArabiaScotlandSenegalSerbiaSierra LeoneSingaporeSomaliaSouth AfricaSouth AmericaSouth Central AsiaSouth Eastern AsiaSouthern EuropeSpainSri LankaSt. Vincent and the GrenadinesSudanSwedenSwitzerlandSyriaTaiwanThailandTrinidad and TobagoTurkeyUgandaUkraineUruguayUzbekistanVenezuelaVietnamWest IndiesWestern AfricaWestern AsiaWestern EuropeYemenZaireZimbabweAzores
Immigrants from Egypt
Race
Ancestry
AfghanAfricanAlaska NativeAlaskan AthabascanAlbanianAleutAlsatianAmericanApacheArabArapahoArgentineanArmenianAssyrian/Chaldean/SyriacAustralianAustrianBahamianBangladeshiBarbadianBasqueBelgianBelizeanBermudanBhutaneseBlackfeetBolivianBrazilianBritishBritish West IndianBulgarianBurmeseCajunCambodianCanadianCape VerdeanCarpatho RusynCelticCentral American IndianCherokeeCheyenneChickasawChileanChineseChippewaChoctawColombianColvilleComancheCosta RicanCreeCreekCroatianCrowCubanCypriotCzechCzechoslovakianDanishDelawareDominicanDutchDutch West IndianEastern EuropeanEcuadorianEgyptianEnglishEstonianEthiopianEuropeanFijianFilipinoFinnishFrenchFrench American IndianFrench CanadianGermanGerman RussianGhanaianGreekGuamanian/ChamorroGuatemalanGuyaneseHaitianHmongHonduranHopiHoumaHungarianIcelanderIndian (Asian)IndonesianInupiatIranianIraqiIrishIroquoisIsraeliItalianJamaicanJapaneseJordanianKenyanKiowaKoreanLaotianLatvianLebaneseLiberianLithuanianLumbeeLuxembourgerMacedonianMalaysianMalteseMarshalleseMenomineeMexicanMexican American IndianMongolianMoroccanNative HawaiianNavajoNepaleseNew ZealanderNicaraguanNigerianNorthern EuropeanNorwegianOkinawanOsageOttawaPaiutePakistaniPalestinianPanamanianParaguayanPennsylvania GermanPeruvianPimaPolishPortuguesePotawatomiPuebloPuerto RicanPuget Sound SalishRomanianRussianSalvadoranSamoanScandinavianScotch-IrishScottishSeminoleSenegaleseSerbianShoshoneSierra LeoneanSiouxSlavicSlovakSloveneSomaliSouth AfricanSouth AmericanSouth American IndianSoviet UnionSpaniardSpanishSpanish AmericanSpanish American IndianSri LankanSubsaharan AfricanSudaneseSwedishSwissSyrianTaiwaneseThaiTlingit-HaidaTohono O'OdhamTonganTrinidadian and TobagonianTsimshianTurkishU.S. Virgin IslanderUgandanUkrainianUruguayanUteVenezuelanVietnameseWelshWest IndianYakamaYaquiYugoslavianYumanYup'ikZimbabwean
Immigration
NonimmigrantsImmigrantsAfghanistanAfricaAlbaniaArgentinaArmeniaAsiaAustraliaAustriaBahamasBangladeshBarbadosBelarusBelgiumBelizeBoliviaBosnia and HerzegovinaBrazilBulgariaBurma/MyanmarCabo VerdeCambodiaCameroonCanadaCaribbeanCentral AmericaChileChinaColombiaCongoCosta RicaCroatiaCubaCzechoslovakiaDenmarkDominicaDominican RepublicEastern AfricaEastern AsiaEastern EuropeEcuadorEgyptEl SalvadorEnglandEritreaEthiopiaEuropeFijiFranceGermanyGhanaGreeceGrenadaGuatemalaGuyanaHaitiHondurasHong KongHungaryIndiaIndonesiaIranIraqIrelandIsraelItalyJamaicaJapanJordanKazakhstanKenyaKoreaKuwaitLaosLatin AmericaLatviaLebanonLiberiaLithuaniaMalaysiaMexicoMicronesiaMiddle AfricaMoldovaMoroccoNepalNetherlandsNicaraguaNigeriaNorth AmericaNorth MacedoniaNorthern AfricaNorthern EuropeNorwayOceaniaPakistanPanamaPeruPhilippinesPolandPortugalRomaniaRussiaSaudi ArabiaScotlandSenegalSerbiaSierra LeoneSingaporeSomaliaSouth AfricaSouth AmericaSouth Central AsiaSouth Eastern AsiaSouthern EuropeSpainSri LankaSt. Vincent and the GrenadinesSudanSwedenSwitzerlandSyriaTaiwanThailandTrinidad and TobagoTurkeyUgandaUkraineUruguayUzbekistanVenezuelaVietnamWest IndiesWestern AfricaWestern AsiaWestern EuropeYemenZaireZimbabweAzores
Unemployment Among Ages 30 to 34 years
Income
Poverty
Unemployment
Labor Participation
Family Structure
Vehicle Availability
Education Level
Disability

Unemployment Among Ages 30 to 34 years Comparison

Central Americans

Immigrants from Egypt

Tragic
Exceptional
5.9%
UNEMPLOYMENT AMONG AGES 30 TO 34 YEARS
0.6/ 100
METRIC RATING
237th/ 347
METRIC RANK
5.2%
UNEMPLOYMENT AMONG AGES 30 TO 34 YEARS
93.9/ 100
METRIC RATING
85th/ 347
METRIC RANK

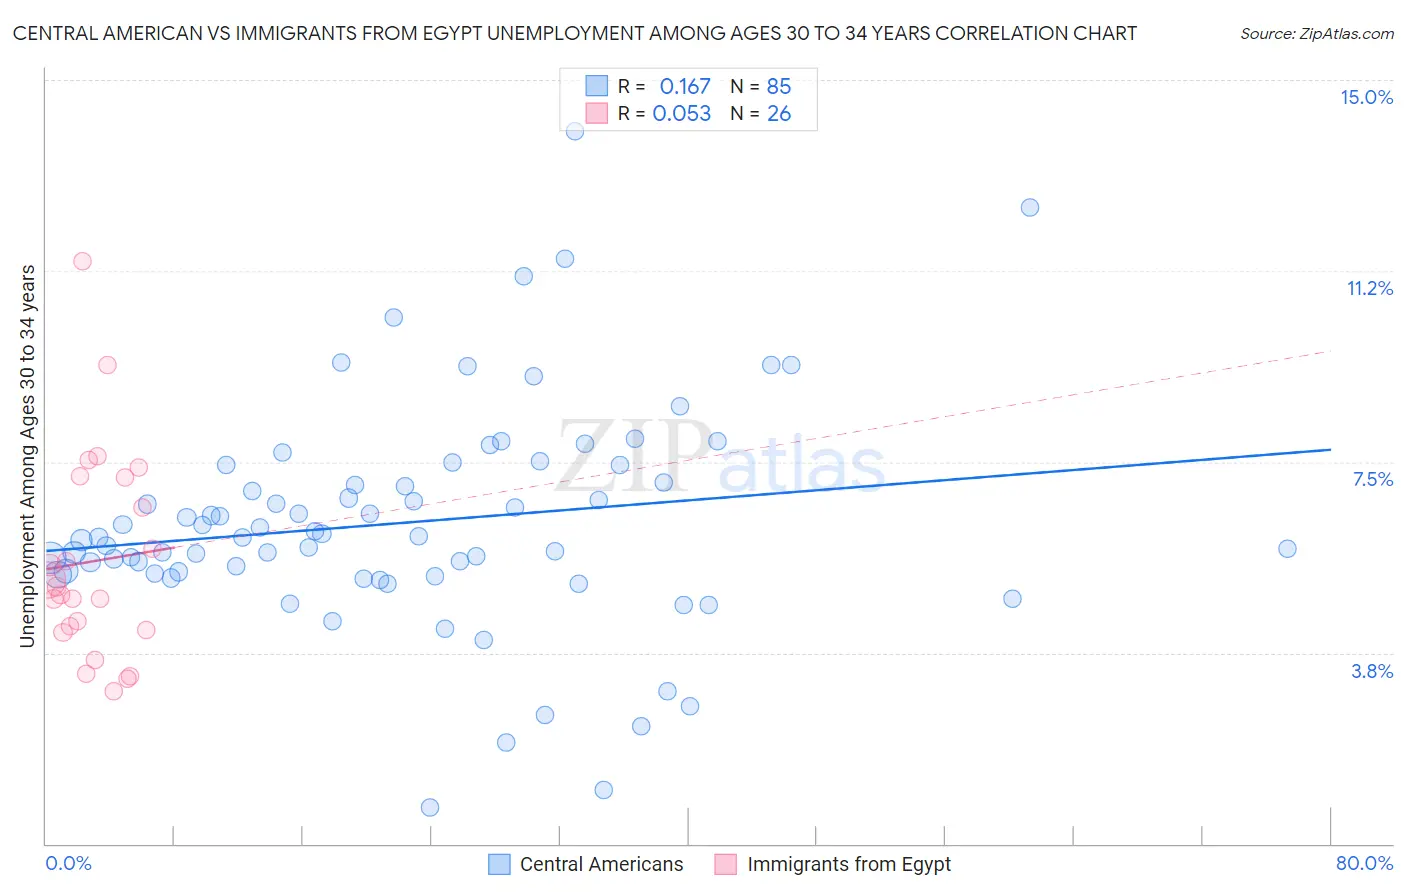
Central American vs Immigrants from Egypt Unemployment Among Ages 30 to 34 years Correlation Chart

The statistical analysis conducted on geographies consisting of 462,932,276 people shows a poor positive correlation between the proportion of Central Americans and unemployment rate among population between the ages 30 and 34 in the United States with a correlation coefficient (R) of 0.167 and weighted average of 5.9%. Similarly, the statistical analysis conducted on geographies consisting of 237,575,255 people shows a slight positive correlation between the proportion of Immigrants from Egypt and unemployment rate among population between the ages 30 and 34 in the United States with a correlation coefficient (R) of 0.053 and weighted average of 5.2%, a difference of 14.2%.
Central American vs Immigrants from Egypt Unemployment Among Ages 30 to 34 years

Unemployment Among Ages 30 to 34 years Correlation Summary

MeasurementCentral AmericanImmigrants from Egypt
Minimum0.70%3.0%
Maximum14.0%11.4%
Range13.3%8.4%
Mean6.3%5.5%
Median6.0%5.0%
Interquartile 25% (IQ1)5.3%4.2%
Interquartile 75% (IQ3)7.3%7.2%
Interquartile Range (IQR)2.0%3.0%
Standard Deviation (Sample)2.2%2.0%
Standard Deviation (Population)2.2%2.0%

Similar Demographics by Unemployment Among Ages 30 to 34 years

Demographics Similar to Central Americans by Unemployment Among Ages 30 to 34 years

In terms of unemployment among ages 30 to 34 years, the demographic groups most similar to Central Americans are Mexican American Indian (5.9%, a difference of 0.090%), Native Hawaiian (5.9%, a difference of 0.17%), Immigrants from Nigeria (6.0%, a difference of 0.17%), Yaqui (5.9%, a difference of 0.29%), and Portuguese (5.9%, a difference of 0.41%).
DemographicsRating | RankUnemployment Among Ages 30 to 34 years
Hawaiians
1.2
/100
|
#230
Tragic
5.9%
Japanese
1.1
/100
|
#231
Tragic
5.9%
Iroquois
1.0
/100
|
#232
Tragic
5.9%
Nepalese
0.8
/100
|
#233
Tragic
5.9%
Portuguese
0.8
/100
|
#234
Tragic
5.9%
Yaqui
0.7
/100
|
#235
Tragic
5.9%
Native Hawaiians
0.7
/100
|
#236
Tragic
5.9%
Central Americans
0.6
/100
|
#237
Tragic
5.9%
Mexican American Indians
0.6
/100
|
#238
Tragic
5.9%
Immigrants | Nigeria
0.6
/100
|
#239
Tragic
6.0%
Salvadorans
0.5
/100
|
#240
Tragic
6.0%
Immigrants | El Salvador
0.5
/100
|
#241
Tragic
6.0%
Guatemalans
0.4
/100
|
#242
Tragic
6.0%
Immigrants | Liberia
0.4
/100
|
#243
Tragic
6.0%
Immigrants | Micronesia
0.3
/100
|
#244
Tragic
6.0%

Demographics Similar to Immigrants from Egypt by Unemployment Among Ages 30 to 34 years

In terms of unemployment among ages 30 to 34 years, the demographic groups most similar to Immigrants from Egypt are Immigrants from Uganda (5.2%, a difference of 0.030%), Immigrants from Korea (5.2%, a difference of 0.080%), Immigrants from Latvia (5.2%, a difference of 0.11%), Immigrants from Australia (5.2%, a difference of 0.11%), and Bhutanese (5.2%, a difference of 0.12%).
DemographicsRating | RankUnemployment Among Ages 30 to 34 years
Indonesians
95.1
/100
|
#78
Exceptional
5.2%
Immigrants | Lithuania
95.0
/100
|
#79
Exceptional
5.2%
Immigrants | Indonesia
94.7
/100
|
#80
Exceptional
5.2%
Chileans
94.4
/100
|
#81
Exceptional
5.2%
Immigrants | Latvia
94.2
/100
|
#82
Exceptional
5.2%
Immigrants | Korea
94.1
/100
|
#83
Exceptional
5.2%
Immigrants | Uganda
94.0
/100
|
#84
Exceptional
5.2%
Immigrants | Egypt
93.9
/100
|
#85
Exceptional
5.2%
Immigrants | Australia
93.5
/100
|
#86
Exceptional
5.2%
Bhutanese
93.5
/100
|
#87
Exceptional
5.2%
Immigrants | Kenya
93.3
/100
|
#88
Exceptional
5.2%
Immigrants | Sweden
93.3
/100
|
#89
Exceptional
5.2%
Immigrants | Romania
92.8
/100
|
#90
Exceptional
5.2%
Iraqis
92.6
/100
|
#91
Exceptional
5.2%
Immigrants | Argentina
92.5
/100
|
#92
Exceptional
5.2%