Central American vs English Unemployment Among Seniors over 65 years
COMPARE
Central American
English
Unemployment Among Seniors over 65 years
Unemployment Among Seniors over 65 years Comparison
Central Americans
English
5.5%
UNEMPLOYMENT AMONG SENIORS OVER 65 YEARS
0.0/ 100
METRIC RATING
285th/ 347
METRIC RANK
4.9%
UNEMPLOYMENT AMONG SENIORS OVER 65 YEARS
99.5/ 100
METRIC RATING
66th/ 347
METRIC RANK
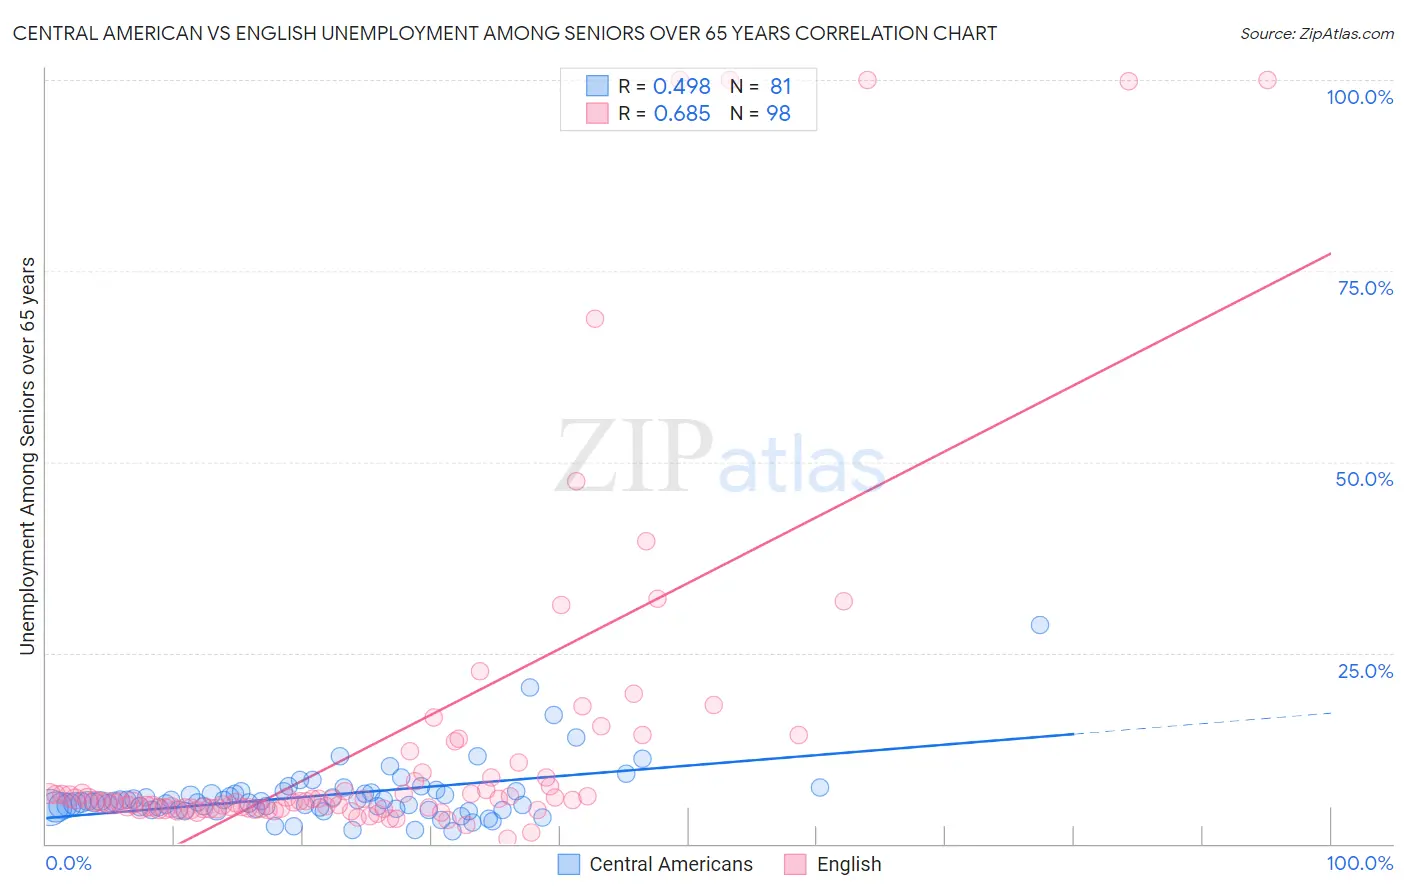
Central American vs English Unemployment Among Seniors over 65 years Correlation Chart
The statistical analysis conducted on geographies consisting of 433,188,019 people shows a moderate positive correlation between the proportion of Central Americans and unemployment rate amomg seniors over the age of 65 in the United States with a correlation coefficient (R) of 0.498 and weighted average of 5.5%. Similarly, the statistical analysis conducted on geographies consisting of 463,344,936 people shows a significant positive correlation between the proportion of English and unemployment rate amomg seniors over the age of 65 in the United States with a correlation coefficient (R) of 0.685 and weighted average of 4.9%, a difference of 11.7%.
Unemployment Among Seniors over 65 years Correlation Summary
| Measurement | Central American | English |
| Minimum | 1.6% | 0.63% |
| Maximum | 28.6% | 100.0% |
| Range | 27.0% | 99.4% |
| Mean | 6.3% | 13.6% |
| Median | 5.4% | 5.7% |
| Interquartile 25% (IQ1) | 4.6% | 4.6% |
| Interquartile 75% (IQ3) | 6.8% | 8.7% |
| Interquartile Range (IQR) | 2.2% | 4.1% |
| Standard Deviation (Sample) | 3.9% | 22.4% |
| Standard Deviation (Population) | 3.9% | 22.3% |
Similar Demographics by Unemployment Among Seniors over 65 years
Demographics Similar to Central Americans by Unemployment Among Seniors over 65 years
In terms of unemployment among seniors over 65 years, the demographic groups most similar to Central Americans are Immigrants from Barbados (5.5%, a difference of 0.030%), Venezuelan (5.5%, a difference of 0.050%), Immigrants from Liberia (5.5%, a difference of 0.060%), U.S. Virgin Islander (5.5%, a difference of 0.060%), and Immigrants from Cabo Verde (5.5%, a difference of 0.080%).
| Demographics | Rating | Rank | Unemployment Among Seniors over 65 years |
| Colville | 0.1 /100 | #278 | Tragic 5.4% |
| Brazilians | 0.1 /100 | #279 | Tragic 5.5% |
| Immigrants | South America | 0.1 /100 | #280 | Tragic 5.5% |
| Immigrants | Norway | 0.0 /100 | #281 | Tragic 5.5% |
| Immigrants | Belize | 0.0 /100 | #282 | Tragic 5.5% |
| Immigrants | Haiti | 0.0 /100 | #283 | Tragic 5.5% |
| Immigrants | Liberia | 0.0 /100 | #284 | Tragic 5.5% |
| Central Americans | 0.0 /100 | #285 | Tragic 5.5% |
| Immigrants | Barbados | 0.0 /100 | #286 | Tragic 5.5% |
| Venezuelans | 0.0 /100 | #287 | Tragic 5.5% |
| U.S. Virgin Islanders | 0.0 /100 | #288 | Tragic 5.5% |
| Immigrants | Cabo Verde | 0.0 /100 | #289 | Tragic 5.5% |
| Jamaicans | 0.0 /100 | #290 | Tragic 5.5% |
| Blacks/African Americans | 0.0 /100 | #291 | Tragic 5.5% |
| Belizeans | 0.0 /100 | #292 | Tragic 5.5% |
Demographics Similar to English by Unemployment Among Seniors over 65 years
In terms of unemployment among seniors over 65 years, the demographic groups most similar to English are Iroquois (4.9%, a difference of 0.020%), Immigrants from Nicaragua (4.9%, a difference of 0.050%), Bolivian (4.9%, a difference of 0.060%), Scottish (4.9%, a difference of 0.10%), and Croatian (4.9%, a difference of 0.13%).
| Demographics | Rating | Rank | Unemployment Among Seniors over 65 years |
| Immigrants | Eastern Africa | 99.7 /100 | #59 | Exceptional 4.9% |
| Immigrants | Middle Africa | 99.7 /100 | #60 | Exceptional 4.9% |
| Northern Europeans | 99.7 /100 | #61 | Exceptional 4.9% |
| Latvians | 99.6 /100 | #62 | Exceptional 4.9% |
| Croatians | 99.6 /100 | #63 | Exceptional 4.9% |
| Immigrants | Cambodia | 99.6 /100 | #64 | Exceptional 4.9% |
| Immigrants | Nicaragua | 99.6 /100 | #65 | Exceptional 4.9% |
| English | 99.5 /100 | #66 | Exceptional 4.9% |
| Iroquois | 99.5 /100 | #67 | Exceptional 4.9% |
| Bolivians | 99.5 /100 | #68 | Exceptional 4.9% |
| Scottish | 99.5 /100 | #69 | Exceptional 4.9% |
| Immigrants | Kazakhstan | 99.4 /100 | #70 | Exceptional 4.9% |
| Immigrants | Moldova | 99.4 /100 | #71 | Exceptional 4.9% |
| Nicaraguans | 99.3 /100 | #72 | Exceptional 4.9% |
| Immigrants | Japan | 99.2 /100 | #73 | Exceptional 4.9% |