Central American Indian vs Immigrants from Dominican Republic Unemployment Among Women with Children Under 6 years
COMPARE
Central American Indian
Immigrants from Dominican Republic
Unemployment Among Women with Children Under 6 years
Unemployment Among Women with Children Under 6 years Comparison
Central American Indians
Immigrants from Dominican Republic
9.6%
UNEMPLOYMENT AMONG WOMEN WITH CHILDREN UNDER 6 YEARS
0.0/ 100
METRIC RATING
321st/ 347
METRIC RANK
8.9%
UNEMPLOYMENT AMONG WOMEN WITH CHILDREN UNDER 6 YEARS
0.0/ 100
METRIC RATING
296th/ 347
METRIC RANK
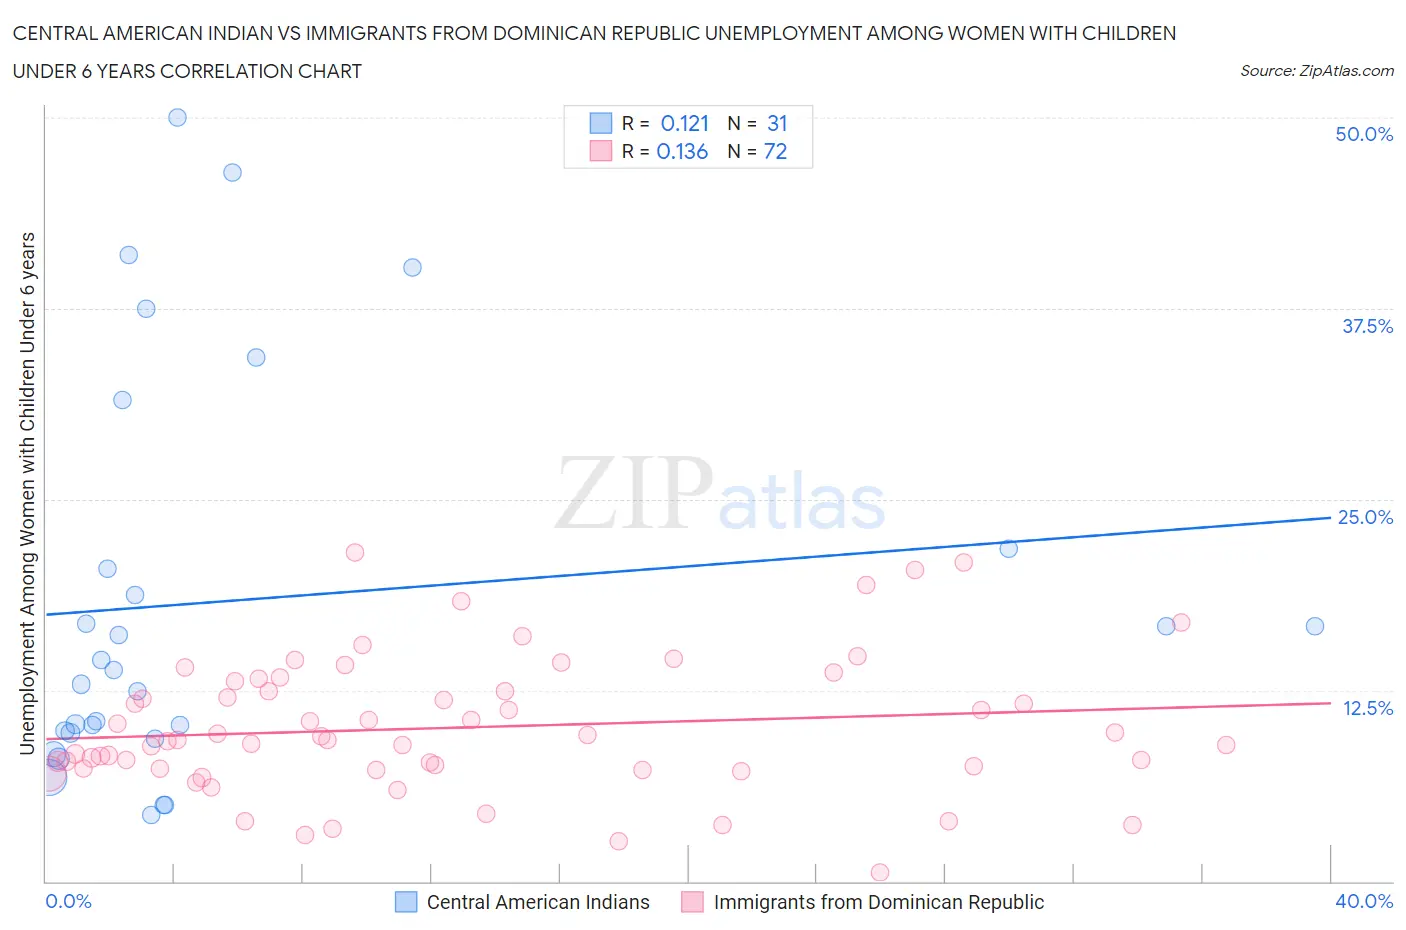
Central American Indian vs Immigrants from Dominican Republic Unemployment Among Women with Children Under 6 years Correlation Chart
The statistical analysis conducted on geographies consisting of 266,688,751 people shows a poor positive correlation between the proportion of Central American Indians and unemployment rate among women with children under the age of 6 in the United States with a correlation coefficient (R) of 0.121 and weighted average of 9.6%. Similarly, the statistical analysis conducted on geographies consisting of 221,187,094 people shows a poor positive correlation between the proportion of Immigrants from Dominican Republic and unemployment rate among women with children under the age of 6 in the United States with a correlation coefficient (R) of 0.136 and weighted average of 8.9%, a difference of 8.1%.
Unemployment Among Women with Children Under 6 years Correlation Summary
| Measurement | Central American Indian | Immigrants from Dominican Republic |
| Minimum | 4.4% | 0.60% |
| Maximum | 50.0% | 21.5% |
| Range | 45.6% | 20.9% |
| Mean | 18.4% | 10.1% |
| Median | 13.8% | 9.3% |
| Interquartile 25% (IQ1) | 9.7% | 7.4% |
| Interquartile 75% (IQ3) | 21.8% | 12.8% |
| Interquartile Range (IQR) | 12.1% | 5.4% |
| Standard Deviation (Sample) | 13.0% | 4.4% |
| Standard Deviation (Population) | 12.8% | 4.4% |
Similar Demographics by Unemployment Among Women with Children Under 6 years
Demographics Similar to Central American Indians by Unemployment Among Women with Children Under 6 years
In terms of unemployment among women with children under 6 years, the demographic groups most similar to Central American Indians are Potawatomi (9.6%, a difference of 0.060%), Marshallese (9.6%, a difference of 0.11%), Alaska Native (9.6%, a difference of 0.25%), Immigrants from Bahamas (9.6%, a difference of 0.44%), and Osage (9.5%, a difference of 1.1%).
| Demographics | Rating | Rank | Unemployment Among Women with Children Under 6 years |
| Fijians | 0.0 /100 | #314 | Tragic 9.3% |
| Cherokee | 0.0 /100 | #315 | Tragic 9.3% |
| Houma | 0.0 /100 | #316 | Tragic 9.4% |
| Dutch West Indians | 0.0 /100 | #317 | Tragic 9.5% |
| Osage | 0.0 /100 | #318 | Tragic 9.5% |
| Marshallese | 0.0 /100 | #319 | Tragic 9.6% |
| Potawatomi | 0.0 /100 | #320 | Tragic 9.6% |
| Central American Indians | 0.0 /100 | #321 | Tragic 9.6% |
| Alaska Natives | 0.0 /100 | #322 | Tragic 9.6% |
| Immigrants | Bahamas | 0.0 /100 | #323 | Tragic 9.6% |
| Paiute | 0.0 /100 | #324 | Tragic 9.7% |
| Choctaw | 0.0 /100 | #325 | Tragic 9.8% |
| Delaware | 0.0 /100 | #326 | Tragic 9.8% |
| Ottawa | 0.0 /100 | #327 | Tragic 9.9% |
| Tohono O'odham | 0.0 /100 | #328 | Tragic 10.2% |
Demographics Similar to Immigrants from Dominican Republic by Unemployment Among Women with Children Under 6 years
In terms of unemployment among women with children under 6 years, the demographic groups most similar to Immigrants from Dominican Republic are Mexican (8.9%, a difference of 0.10%), Immigrants from Central America (8.9%, a difference of 0.13%), Nonimmigrants (8.8%, a difference of 0.18%), Tlingit-Haida (8.9%, a difference of 0.25%), and Immigrants from Bangladesh (8.8%, a difference of 0.36%).
| Demographics | Rating | Rank | Unemployment Among Women with Children Under 6 years |
| Iroquois | 0.0 /100 | #289 | Tragic 8.7% |
| Vietnamese | 0.0 /100 | #290 | Tragic 8.8% |
| Jamaicans | 0.0 /100 | #291 | Tragic 8.8% |
| Cheyenne | 0.0 /100 | #292 | Tragic 8.8% |
| Immigrants | Bangladesh | 0.0 /100 | #293 | Tragic 8.8% |
| Immigrants | Nonimmigrants | 0.0 /100 | #294 | Tragic 8.8% |
| Immigrants | Central America | 0.0 /100 | #295 | Tragic 8.9% |
| Immigrants | Dominican Republic | 0.0 /100 | #296 | Tragic 8.9% |
| Mexicans | 0.0 /100 | #297 | Tragic 8.9% |
| Tlingit-Haida | 0.0 /100 | #298 | Tragic 8.9% |
| Immigrants | Jamaica | 0.0 /100 | #299 | Tragic 8.9% |
| Creek | 0.0 /100 | #300 | Tragic 8.9% |
| Chickasaw | 0.0 /100 | #301 | Tragic 9.0% |
| Hispanics or Latinos | 0.0 /100 | #302 | Tragic 9.0% |
| Immigrants | West Indies | 0.0 /100 | #303 | Tragic 9.0% |