Cape Verdean vs Tsimshian Unemployment Among Ages 55 to 59 years
COMPARE
Cape Verdean
Tsimshian
Unemployment Among Ages 55 to 59 years
Unemployment Among Ages 55 to 59 years Comparison
Cape Verdeans
Tsimshian
5.4%
UNEMPLOYMENT AMONG AGES 55 TO 59 YEARS
0.0/ 100
METRIC RATING
299th/ 347
METRIC RANK
5.2%
UNEMPLOYMENT AMONG AGES 55 TO 59 YEARS
0.1/ 100
METRIC RATING
269th/ 347
METRIC RANK
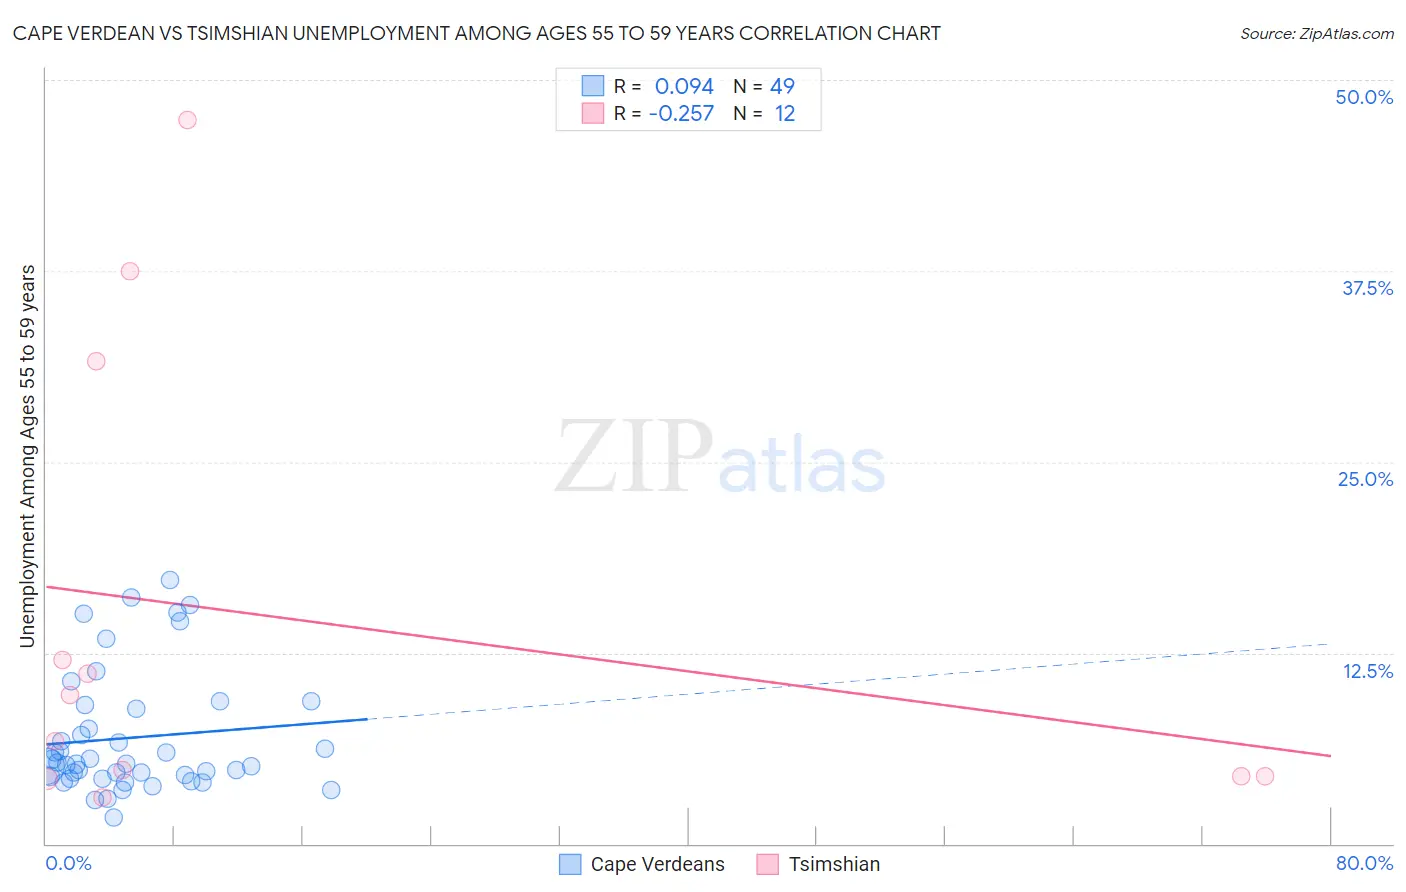
Cape Verdean vs Tsimshian Unemployment Among Ages 55 to 59 years Correlation Chart
The statistical analysis conducted on geographies consisting of 105,001,365 people shows a slight positive correlation between the proportion of Cape Verdeans and unemployment rate among population between the ages 55 and 59 in the United States with a correlation coefficient (R) of 0.094 and weighted average of 5.4%. Similarly, the statistical analysis conducted on geographies consisting of 15,380,482 people shows a weak negative correlation between the proportion of Tsimshian and unemployment rate among population between the ages 55 and 59 in the United States with a correlation coefficient (R) of -0.257 and weighted average of 5.2%, a difference of 5.1%.
Unemployment Among Ages 55 to 59 years Correlation Summary
| Measurement | Cape Verdean | Tsimshian |
| Minimum | 1.7% | 3.0% |
| Maximum | 17.3% | 47.4% |
| Range | 15.6% | 44.4% |
| Mean | 6.9% | 14.7% |
| Median | 5.2% | 8.2% |
| Interquartile 25% (IQ1) | 4.4% | 4.4% |
| Interquartile 75% (IQ3) | 8.9% | 21.8% |
| Interquartile Range (IQR) | 4.6% | 17.4% |
| Standard Deviation (Sample) | 4.0% | 15.2% |
| Standard Deviation (Population) | 3.9% | 14.6% |
Similar Demographics by Unemployment Among Ages 55 to 59 years
Demographics Similar to Cape Verdeans by Unemployment Among Ages 55 to 59 years
In terms of unemployment among ages 55 to 59 years, the demographic groups most similar to Cape Verdeans are Immigrants from St. Vincent and the Grenadines (5.4%, a difference of 0.14%), Immigrants from Dominica (5.5%, a difference of 0.38%), Sierra Leonean (5.5%, a difference of 0.78%), Marshallese (5.5%, a difference of 0.79%), and Hispanic or Latino (5.4%, a difference of 1.2%).
| Demographics | Rating | Rank | Unemployment Among Ages 55 to 59 years |
| British West Indians | 0.0 /100 | #292 | Tragic 5.3% |
| Immigrants | Grenada | 0.0 /100 | #293 | Tragic 5.3% |
| Cajuns | 0.0 /100 | #294 | Tragic 5.3% |
| Dutch West Indians | 0.0 /100 | #295 | Tragic 5.3% |
| Barbadians | 0.0 /100 | #296 | Tragic 5.3% |
| Immigrants | Mexico | 0.0 /100 | #297 | Tragic 5.3% |
| Hispanics or Latinos | 0.0 /100 | #298 | Tragic 5.4% |
| Cape Verdeans | 0.0 /100 | #299 | Tragic 5.4% |
| Immigrants | St. Vincent and the Grenadines | 0.0 /100 | #300 | Tragic 5.4% |
| Immigrants | Dominica | 0.0 /100 | #301 | Tragic 5.5% |
| Sierra Leoneans | 0.0 /100 | #302 | Tragic 5.5% |
| Marshallese | 0.0 /100 | #303 | Tragic 5.5% |
| Blacks/African Americans | 0.0 /100 | #304 | Tragic 5.5% |
| Immigrants | Portugal | 0.0 /100 | #305 | Tragic 5.5% |
| Immigrants | Cabo Verde | 0.0 /100 | #306 | Tragic 5.5% |
Demographics Similar to Tsimshian by Unemployment Among Ages 55 to 59 years
In terms of unemployment among ages 55 to 59 years, the demographic groups most similar to Tsimshian are Mexican (5.2%, a difference of 0.020%), Immigrants from Senegal (5.2%, a difference of 0.030%), Jamaican (5.2%, a difference of 0.040%), Yaqui (5.2%, a difference of 0.060%), and Immigrants from Caribbean (5.2%, a difference of 0.12%).
| Demographics | Rating | Rank | Unemployment Among Ages 55 to 59 years |
| Immigrants | El Salvador | 0.1 /100 | #262 | Tragic 5.1% |
| Immigrants | Sierra Leone | 0.1 /100 | #263 | Tragic 5.2% |
| Immigrants | Caribbean | 0.1 /100 | #264 | Tragic 5.2% |
| Yaqui | 0.1 /100 | #265 | Tragic 5.2% |
| Jamaicans | 0.1 /100 | #266 | Tragic 5.2% |
| Immigrants | Senegal | 0.1 /100 | #267 | Tragic 5.2% |
| Mexicans | 0.1 /100 | #268 | Tragic 5.2% |
| Tsimshian | 0.1 /100 | #269 | Tragic 5.2% |
| Ute | 0.1 /100 | #270 | Tragic 5.2% |
| Cree | 0.1 /100 | #271 | Tragic 5.2% |
| Immigrants | Jamaica | 0.0 /100 | #272 | Tragic 5.2% |
| Ottawa | 0.0 /100 | #273 | Tragic 5.2% |
| Mexican American Indians | 0.0 /100 | #274 | Tragic 5.2% |
| Israelis | 0.0 /100 | #275 | Tragic 5.2% |
| West Indians | 0.0 /100 | #276 | Tragic 5.2% |