Cape Verdean vs Immigrants from Turkey Unemployment Among Ages 16 to 19 years
COMPARE
Cape Verdean
Immigrants from Turkey
Unemployment Among Ages 16 to 19 years
Unemployment Among Ages 16 to 19 years Comparison
Cape Verdeans
Immigrants from Turkey
17.5%
UNEMPLOYMENT AMONG AGES 16 TO 19 YEARS
55.8/ 100
METRIC RATING
165th/ 347
METRIC RANK
17.6%
UNEMPLOYMENT AMONG AGES 16 TO 19 YEARS
45.6/ 100
METRIC RATING
181st/ 347
METRIC RANK
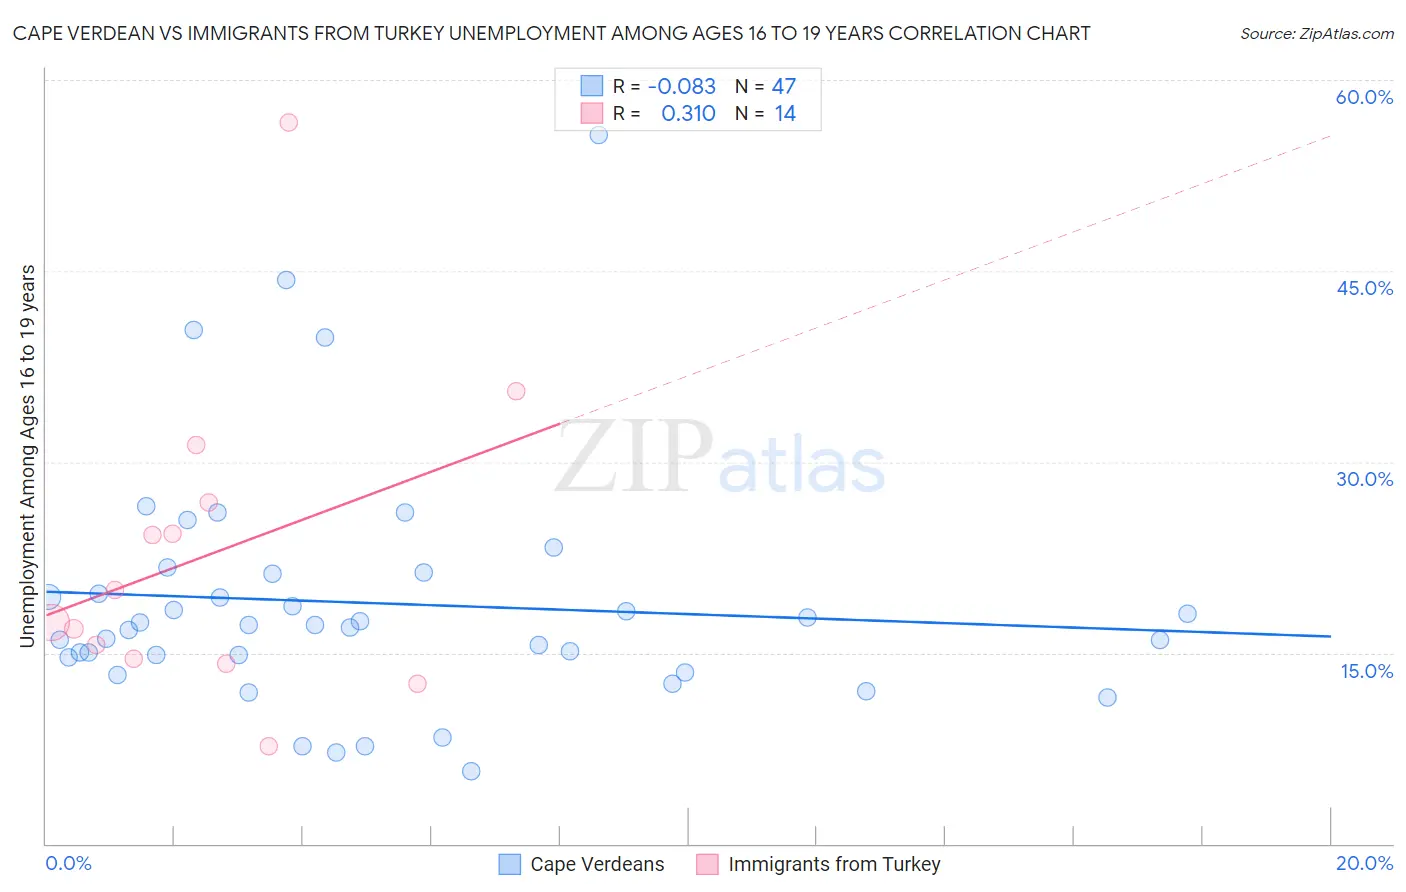
Cape Verdean vs Immigrants from Turkey Unemployment Among Ages 16 to 19 years Correlation Chart
The statistical analysis conducted on geographies consisting of 105,654,451 people shows a slight negative correlation between the proportion of Cape Verdeans and unemployment rate among population between the ages 16 and 19 in the United States with a correlation coefficient (R) of -0.083 and weighted average of 17.5%. Similarly, the statistical analysis conducted on geographies consisting of 215,488,732 people shows a mild positive correlation between the proportion of Immigrants from Turkey and unemployment rate among population between the ages 16 and 19 in the United States with a correlation coefficient (R) of 0.310 and weighted average of 17.6%, a difference of 0.49%.
Unemployment Among Ages 16 to 19 years Correlation Summary
| Measurement | Cape Verdean | Immigrants from Turkey |
| Minimum | 5.7% | 7.7% |
| Maximum | 55.7% | 56.7% |
| Range | 50.0% | 49.0% |
| Mean | 18.9% | 22.7% |
| Median | 17.2% | 18.7% |
| Interquartile 25% (IQ1) | 14.6% | 14.5% |
| Interquartile 75% (IQ3) | 21.2% | 26.8% |
| Interquartile Range (IQR) | 6.6% | 12.3% |
| Standard Deviation (Sample) | 9.6% | 12.4% |
| Standard Deviation (Population) | 9.5% | 12.0% |
Demographics Similar to Cape Verdeans and Immigrants from Turkey by Unemployment Among Ages 16 to 19 years
In terms of unemployment among ages 16 to 19 years, the demographic groups most similar to Cape Verdeans are Immigrants from Italy (17.5%, a difference of 0.030%), Immigrants from France (17.5%, a difference of 0.040%), Immigrants from Hungary (17.5%, a difference of 0.050%), Immigrants from Cambodia (17.5%, a difference of 0.060%), and Immigrants from Austria (17.5%, a difference of 0.090%). Similarly, the demographic groups most similar to Immigrants from Turkey are Russian (17.6%, a difference of 0.020%), Immigrants from Uruguay (17.6%, a difference of 0.050%), Spaniard (17.6%, a difference of 0.070%), American (17.6%, a difference of 0.090%), and Bermudan (17.6%, a difference of 0.15%).
| Demographics | Rating | Rank | Unemployment Among Ages 16 to 19 years |
| Egyptians | 59.7 /100 | #163 | Average 17.5% |
| Immigrants | Austria | 57.7 /100 | #164 | Average 17.5% |
| Cape Verdeans | 55.8 /100 | #165 | Average 17.5% |
| Immigrants | Italy | 55.2 /100 | #166 | Average 17.5% |
| Immigrants | France | 54.9 /100 | #167 | Average 17.5% |
| Immigrants | Hungary | 54.7 /100 | #168 | Average 17.5% |
| Immigrants | Cambodia | 54.5 /100 | #169 | Average 17.5% |
| Immigrants | Romania | 53.3 /100 | #170 | Average 17.5% |
| Immigrants | Switzerland | 53.2 /100 | #171 | Average 17.5% |
| Immigrants | Western Europe | 52.2 /100 | #172 | Average 17.6% |
| Chileans | 50.8 /100 | #173 | Average 17.6% |
| Osage | 50.0 /100 | #174 | Average 17.6% |
| Immigrants | Sweden | 49.1 /100 | #175 | Average 17.6% |
| Nicaraguans | 48.9 /100 | #176 | Average 17.6% |
| Bermudans | 48.7 /100 | #177 | Average 17.6% |
| Celtics | 48.7 /100 | #178 | Average 17.6% |
| Americans | 47.4 /100 | #179 | Average 17.6% |
| Spaniards | 47.1 /100 | #180 | Average 17.6% |
| Immigrants | Turkey | 45.6 /100 | #181 | Average 17.6% |
| Russians | 45.2 /100 | #182 | Average 17.6% |
| Immigrants | Uruguay | 44.6 /100 | #183 | Average 17.6% |