Cape Verdean vs Immigrants from Bulgaria Unemployment

COMPARE

Cape Verdean
Race
Ancestry
AfghanAfricanAlaska NativeAlaskan AthabascanAlbanianAleutAlsatianAmericanApacheArabArapahoArgentineanArmenianAssyrian/Chaldean/SyriacAustralianAustrianBahamianBangladeshiBarbadianBasqueBelgianBelizeanBermudanBhutaneseBlackfeetBolivianBrazilianBritishBritish West IndianBulgarianBurmeseCajunCambodianCanadianCape VerdeanCarpatho RusynCelticCentral AmericanCentral American IndianCherokeeCheyenneChickasawChileanChineseChippewaChoctawColombianColvilleComancheCosta RicanCreeCreekCroatianCrowCubanCypriotCzechCzechoslovakianDanishDelawareDominicanDutchDutch West IndianEastern EuropeanEcuadorianEgyptianEnglishEstonianEthiopianEuropeanFijianFilipinoFinnishFrenchFrench American IndianFrench CanadianGermanGerman RussianGhanaianGreekGuamanian/ChamorroGuatemalanGuyaneseHaitianHmongHonduranHopiHoumaHungarianIcelanderIndian (Asian)IndonesianInupiatIranianIraqiIrishIroquoisIsraeliItalianJamaicanJapaneseJordanianKenyanKiowaKoreanLaotianLatvianLebaneseLiberianLithuanianLumbeeLuxembourgerMacedonianMalaysianMalteseMarshalleseMenomineeMexicanMexican American IndianMongolianMoroccanNative HawaiianNavajoNepaleseNew ZealanderNicaraguanNigerianNorthern EuropeanNorwegianOkinawanOsageOttawaPaiutePakistaniPalestinianPanamanianParaguayanPennsylvania GermanPeruvianPimaPolishPortuguesePotawatomiPuebloPuerto RicanPuget Sound SalishRomanianRussianSalvadoranSamoanScandinavianScotch-IrishScottishSeminoleSenegaleseSerbianShoshoneSierra LeoneanSiouxSlavicSlovakSloveneSomaliSouth AfricanSouth AmericanSouth American IndianSoviet UnionSpaniardSpanishSpanish AmericanSpanish American IndianSri LankanSubsaharan AfricanSudaneseSwedishSwissSyrianTaiwaneseThaiTlingit-HaidaTohono O'OdhamTonganTrinidadian and TobagonianTsimshianTurkishU.S. Virgin IslanderUgandanUkrainianUruguayanUteVenezuelanVietnameseWelshWest IndianYakamaYaquiYugoslavianYumanYup'ikZimbabwean
Immigration
NonimmigrantsImmigrantsAfghanistanAfricaAlbaniaArgentinaArmeniaAsiaAustraliaAustriaBahamasBangladeshBarbadosBelarusBelgiumBelizeBoliviaBosnia and HerzegovinaBrazilBurma/MyanmarCabo VerdeCambodiaCameroonCanadaCaribbeanCentral AmericaChileChinaColombiaCongoCosta RicaCroatiaCubaCzechoslovakiaDenmarkDominicaDominican RepublicEastern AfricaEastern AsiaEastern EuropeEcuadorEgyptEl SalvadorEnglandEritreaEthiopiaEuropeFijiFranceGermanyGhanaGreeceGrenadaGuatemalaGuyanaHaitiHondurasHong KongHungaryIndiaIndonesiaIranIraqIrelandIsraelItalyJamaicaJapanJordanKazakhstanKenyaKoreaKuwaitLaosLatin AmericaLatviaLebanonLiberiaLithuaniaMalaysiaMexicoMicronesiaMiddle AfricaMoldovaMoroccoNepalNetherlandsNicaraguaNigeriaNorth AmericaNorth MacedoniaNorthern AfricaNorthern EuropeNorwayOceaniaPakistanPanamaPeruPhilippinesPolandPortugalRomaniaRussiaSaudi ArabiaScotlandSenegalSerbiaSierra LeoneSingaporeSomaliaSouth AfricaSouth AmericaSouth Central AsiaSouth Eastern AsiaSouthern EuropeSpainSri LankaSt. Vincent and the GrenadinesSudanSwedenSwitzerlandSyriaTaiwanThailandTrinidad and TobagoTurkeyUgandaUkraineUruguayUzbekistanVenezuelaVietnamWest IndiesWestern AfricaWestern AsiaWestern EuropeYemenZaireZimbabweAzores
Immigrants from Bulgaria
Race
Ancestry
AfghanAfricanAlaska NativeAlaskan AthabascanAlbanianAleutAlsatianAmericanApacheArabArapahoArgentineanArmenianAssyrian/Chaldean/SyriacAustralianAustrianBahamianBangladeshiBarbadianBasqueBelgianBelizeanBermudanBhutaneseBlackfeetBolivianBrazilianBritishBritish West IndianBulgarianBurmeseCajunCambodianCanadianCarpatho RusynCelticCentral AmericanCentral American IndianCherokeeCheyenneChickasawChileanChineseChippewaChoctawColombianColvilleComancheCosta RicanCreeCreekCroatianCrowCubanCypriotCzechCzechoslovakianDanishDelawareDominicanDutchDutch West IndianEastern EuropeanEcuadorianEgyptianEnglishEstonianEthiopianEuropeanFijianFilipinoFinnishFrenchFrench American IndianFrench CanadianGermanGerman RussianGhanaianGreekGuamanian/ChamorroGuatemalanGuyaneseHaitianHmongHonduranHopiHoumaHungarianIcelanderIndian (Asian)IndonesianInupiatIranianIraqiIrishIroquoisIsraeliItalianJamaicanJapaneseJordanianKenyanKiowaKoreanLaotianLatvianLebaneseLiberianLithuanianLumbeeLuxembourgerMacedonianMalaysianMalteseMarshalleseMenomineeMexicanMexican American IndianMongolianMoroccanNative HawaiianNavajoNepaleseNew ZealanderNicaraguanNigerianNorthern EuropeanNorwegianOkinawanOsageOttawaPaiutePakistaniPalestinianPanamanianParaguayanPennsylvania GermanPeruvianPimaPolishPortuguesePotawatomiPuebloPuerto RicanPuget Sound SalishRomanianRussianSalvadoranSamoanScandinavianScotch-IrishScottishSeminoleSenegaleseSerbianShoshoneSierra LeoneanSiouxSlavicSlovakSloveneSomaliSouth AfricanSouth AmericanSouth American IndianSoviet UnionSpaniardSpanishSpanish AmericanSpanish American IndianSri LankanSubsaharan AfricanSudaneseSwedishSwissSyrianTaiwaneseThaiTlingit-HaidaTohono O'OdhamTonganTrinidadian and TobagonianTsimshianTurkishU.S. Virgin IslanderUgandanUkrainianUruguayanUteVenezuelanVietnameseWelshWest IndianYakamaYaquiYugoslavianYumanYup'ikZimbabwean
Immigration
NonimmigrantsImmigrantsAfghanistanAfricaAlbaniaArgentinaArmeniaAsiaAustraliaAustriaBahamasBangladeshBarbadosBelarusBelgiumBelizeBoliviaBosnia and HerzegovinaBrazilBulgariaBurma/MyanmarCabo VerdeCambodiaCameroonCanadaCaribbeanCentral AmericaChileChinaColombiaCongoCosta RicaCroatiaCubaCzechoslovakiaDenmarkDominicaDominican RepublicEastern AfricaEastern AsiaEastern EuropeEcuadorEgyptEl SalvadorEnglandEritreaEthiopiaEuropeFijiFranceGermanyGhanaGreeceGrenadaGuatemalaGuyanaHaitiHondurasHong KongHungaryIndiaIndonesiaIranIraqIrelandIsraelItalyJamaicaJapanJordanKazakhstanKenyaKoreaKuwaitLaosLatin AmericaLatviaLebanonLiberiaLithuaniaMalaysiaMexicoMicronesiaMiddle AfricaMoldovaMoroccoNepalNetherlandsNicaraguaNigeriaNorth AmericaNorth MacedoniaNorthern AfricaNorthern EuropeNorwayOceaniaPakistanPanamaPeruPhilippinesPolandPortugalRomaniaRussiaSaudi ArabiaScotlandSenegalSerbiaSierra LeoneSingaporeSomaliaSouth AfricaSouth AmericaSouth Central AsiaSouth Eastern AsiaSouthern EuropeSpainSri LankaSt. Vincent and the GrenadinesSudanSwedenSwitzerlandSyriaTaiwanThailandTrinidad and TobagoTurkeyUgandaUkraineUruguayUzbekistanVenezuelaVietnamWest IndiesWestern AfricaWestern AsiaWestern EuropeYemenZaireZimbabweAzores
Unemployment
Income
Poverty
Unemployment
Labor Participation
Family Structure
Vehicle Availability
Education Level
Disability

Unemployment Comparison

Cape Verdeans

Immigrants from Bulgaria

Tragic
Exceptional
6.5%
UNEMPLOYMENT
0.0/ 100
METRIC RATING
311th/ 347
METRIC RANK
4.9%
UNEMPLOYMENT
98.9/ 100
METRIC RATING
63rd/ 347
METRIC RANK

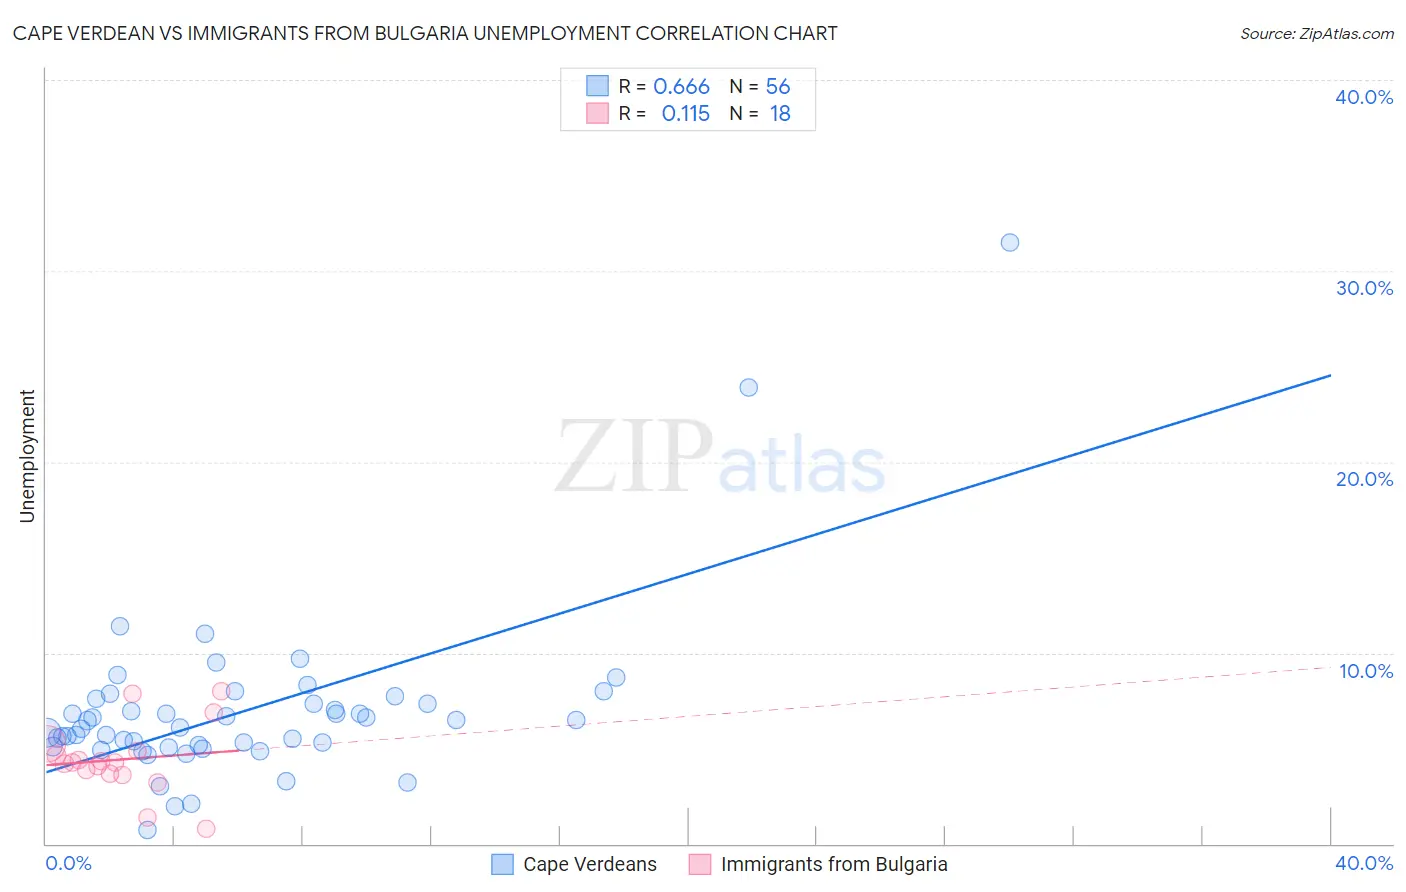
Cape Verdean vs Immigrants from Bulgaria Unemployment Correlation Chart

The statistical analysis conducted on geographies consisting of 107,538,461 people shows a significant positive correlation between the proportion of Cape Verdeans and unemployment in the United States with a correlation coefficient (R) of 0.666 and weighted average of 6.5%. Similarly, the statistical analysis conducted on geographies consisting of 172,511,279 people shows a poor positive correlation between the proportion of Immigrants from Bulgaria and unemployment in the United States with a correlation coefficient (R) of 0.115 and weighted average of 4.9%, a difference of 33.6%.
Cape Verdean vs Immigrants from Bulgaria Unemployment

Unemployment Correlation Summary

MeasurementCape VerdeanImmigrants from Bulgaria
Minimum0.70%0.80%
Maximum31.5%8.0%
Range30.8%7.2%
Mean6.9%4.4%
Median6.3%4.2%
Interquartile 25% (IQ1)5.1%3.6%
Interquartile 75% (IQ3)7.5%4.9%
Interquartile Range (IQR)2.3%1.2%
Standard Deviation (Sample)4.6%1.8%
Standard Deviation (Population)4.5%1.8%

Similar Demographics by Unemployment

Demographics Similar to Cape Verdeans by Unemployment

In terms of unemployment, the demographic groups most similar to Cape Verdeans are Immigrants from Belize (6.5%, a difference of 0.33%), Colville (6.6%, a difference of 0.57%), Vietnamese (6.5%, a difference of 0.60%), Barbadian (6.5%, a difference of 0.61%), and Immigrants from Barbados (6.6%, a difference of 0.95%).
DemographicsRating | RankUnemployment
Immigrants | Jamaica
0.0
/100
|
#304
Tragic
6.4%
Menominee
0.0
/100
|
#305
Tragic
6.4%
Lumbee
0.0
/100
|
#306
Tragic
6.4%
Immigrants | Bangladesh
0.0
/100
|
#307
Tragic
6.5%
Barbadians
0.0
/100
|
#308
Tragic
6.5%
Vietnamese
0.0
/100
|
#309
Tragic
6.5%
Immigrants | Belize
0.0
/100
|
#310
Tragic
6.5%
Cape Verdeans
0.0
/100
|
#311
Tragic
6.5%
Colville
0.0
/100
|
#312
Tragic
6.6%
Immigrants | Barbados
0.0
/100
|
#313
Tragic
6.6%
Blacks/African Americans
0.0
/100
|
#314
Tragic
6.6%
Houma
0.0
/100
|
#315
Tragic
6.7%
Immigrants | Dominica
0.0
/100
|
#316
Tragic
6.7%
Shoshone
0.0
/100
|
#317
Tragic
6.8%
Immigrants | Cabo Verde
0.0
/100
|
#318
Tragic
6.8%

Demographics Similar to Immigrants from Bulgaria by Unemployment

In terms of unemployment, the demographic groups most similar to Immigrants from Bulgaria are Icelander (4.9%, a difference of 0.010%), Immigrants from Netherlands (4.9%, a difference of 0.030%), Cambodian (4.9%, a difference of 0.030%), Bhutanese (4.9%, a difference of 0.070%), and Italian (4.9%, a difference of 0.080%).
DemographicsRating | RankUnemployment
Celtics
99.1
/100
|
#56
Exceptional
4.9%
Immigrants | Singapore
99.1
/100
|
#57
Exceptional
4.9%
Greeks
99.0
/100
|
#58
Exceptional
4.9%
Bhutanese
99.0
/100
|
#59
Exceptional
4.9%
Immigrants | Netherlands
99.0
/100
|
#60
Exceptional
4.9%
Cambodians
99.0
/100
|
#61
Exceptional
4.9%
Icelanders
98.9
/100
|
#62
Exceptional
4.9%
Immigrants | Bulgaria
98.9
/100
|
#63
Exceptional
4.9%
Italians
98.9
/100
|
#64
Exceptional
4.9%
Immigrants | Canada
98.8
/100
|
#65
Exceptional
4.9%
Slovaks
98.7
/100
|
#66
Exceptional
4.9%
New Zealanders
98.6
/100
|
#67
Exceptional
4.9%
Slavs
98.6
/100
|
#68
Exceptional
4.9%
Immigrants | North America
98.5
/100
|
#69
Exceptional
4.9%
Serbians
98.4
/100
|
#70
Exceptional
4.9%