Canadian vs Okinawan Unemployment Among Ages 16 to 19 years
COMPARE
Canadian
Okinawan
Unemployment Among Ages 16 to 19 years
Unemployment Among Ages 16 to 19 years Comparison
Canadians
Okinawans
16.9%
UNEMPLOYMENT AMONG AGES 16 TO 19 YEARS
96.7/ 100
METRIC RATING
89th/ 347
METRIC RANK
16.6%
UNEMPLOYMENT AMONG AGES 16 TO 19 YEARS
98.9/ 100
METRIC RATING
66th/ 347
METRIC RANK
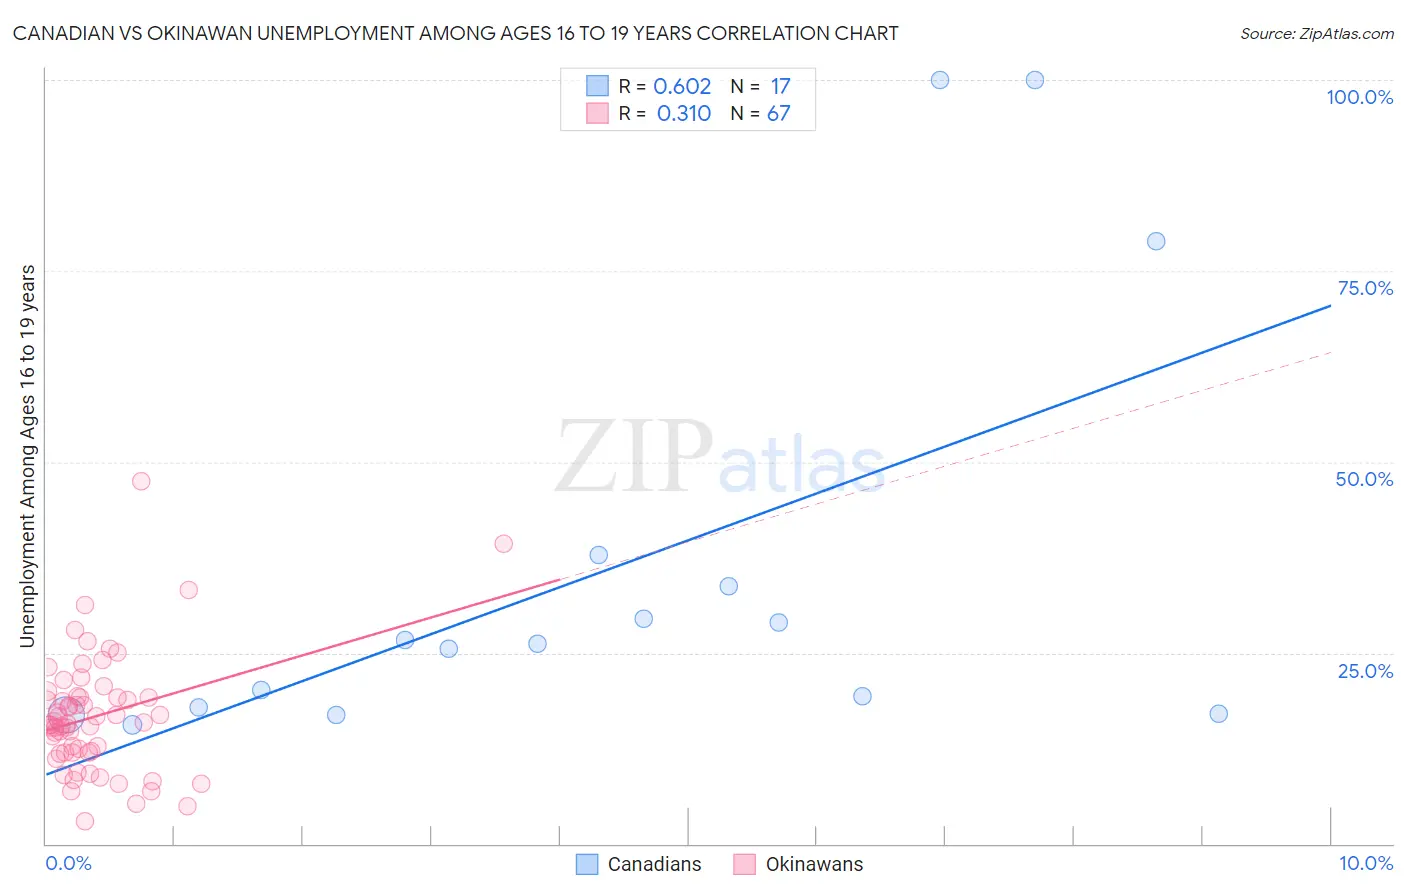
Canadian vs Okinawan Unemployment Among Ages 16 to 19 years Correlation Chart
The statistical analysis conducted on geographies consisting of 409,401,649 people shows a significant positive correlation between the proportion of Canadians and unemployment rate among population between the ages 16 and 19 in the United States with a correlation coefficient (R) of 0.602 and weighted average of 16.9%. Similarly, the statistical analysis conducted on geographies consisting of 72,749,515 people shows a mild positive correlation between the proportion of Okinawans and unemployment rate among population between the ages 16 and 19 in the United States with a correlation coefficient (R) of 0.310 and weighted average of 16.6%, a difference of 1.4%.
Unemployment Among Ages 16 to 19 years Correlation Summary
| Measurement | Canadian | Okinawan |
| Minimum | 15.6% | 2.9% |
| Maximum | 100.0% | 47.4% |
| Range | 84.4% | 44.5% |
| Mean | 35.9% | 16.7% |
| Median | 26.2% | 15.7% |
| Interquartile 25% (IQ1) | 17.4% | 11.9% |
| Interquartile 75% (IQ3) | 35.8% | 19.2% |
| Interquartile Range (IQR) | 18.4% | 7.3% |
| Standard Deviation (Sample) | 28.3% | 7.8% |
| Standard Deviation (Population) | 27.4% | 7.7% |
Similar Demographics by Unemployment Among Ages 16 to 19 years
Demographics Similar to Canadians by Unemployment Among Ages 16 to 19 years
In terms of unemployment among ages 16 to 19 years, the demographic groups most similar to Canadians are Asian (16.9%, a difference of 0.040%), Immigrants from South Africa (16.9%, a difference of 0.090%), Cambodian (16.9%, a difference of 0.12%), Greek (16.9%, a difference of 0.15%), and Immigrants from Scotland (16.8%, a difference of 0.22%).
| Demographics | Rating | Rank | Unemployment Among Ages 16 to 19 years |
| Whites/Caucasians | 97.5 /100 | #82 | Exceptional 16.8% |
| Ugandans | 97.4 /100 | #83 | Exceptional 16.8% |
| French | 97.4 /100 | #84 | Exceptional 16.8% |
| Immigrants | Kuwait | 97.2 /100 | #85 | Exceptional 16.8% |
| Immigrants | Scotland | 97.2 /100 | #86 | Exceptional 16.8% |
| Greeks | 97.0 /100 | #87 | Exceptional 16.9% |
| Immigrants | South Africa | 96.9 /100 | #88 | Exceptional 16.9% |
| Canadians | 96.7 /100 | #89 | Exceptional 16.9% |
| Asians | 96.6 /100 | #90 | Exceptional 16.9% |
| Cambodians | 96.3 /100 | #91 | Exceptional 16.9% |
| South Africans | 95.9 /100 | #92 | Exceptional 16.9% |
| Cubans | 95.8 /100 | #93 | Exceptional 16.9% |
| Bangladeshis | 95.8 /100 | #94 | Exceptional 16.9% |
| Mongolians | 95.6 /100 | #95 | Exceptional 16.9% |
| Ottawa | 95.4 /100 | #96 | Exceptional 16.9% |
Demographics Similar to Okinawans by Unemployment Among Ages 16 to 19 years
In terms of unemployment among ages 16 to 19 years, the demographic groups most similar to Okinawans are Immigrants from Japan (16.6%, a difference of 0.030%), Northern European (16.6%, a difference of 0.13%), Slavic (16.7%, a difference of 0.17%), Chickasaw (16.7%, a difference of 0.17%), and Scotch-Irish (16.6%, a difference of 0.20%).
| Demographics | Rating | Rank | Unemployment Among Ages 16 to 19 years |
| Irish | 99.4 /100 | #59 | Exceptional 16.5% |
| Menominee | 99.3 /100 | #60 | Exceptional 16.6% |
| Immigrants | Cuba | 99.2 /100 | #61 | Exceptional 16.6% |
| Macedonians | 99.2 /100 | #62 | Exceptional 16.6% |
| Scotch-Irish | 99.1 /100 | #63 | Exceptional 16.6% |
| Northern Europeans | 99.0 /100 | #64 | Exceptional 16.6% |
| Immigrants | Japan | 98.9 /100 | #65 | Exceptional 16.6% |
| Okinawans | 98.9 /100 | #66 | Exceptional 16.6% |
| Slavs | 98.7 /100 | #67 | Exceptional 16.7% |
| Chickasaw | 98.7 /100 | #68 | Exceptional 16.7% |
| Serbians | 98.7 /100 | #69 | Exceptional 16.7% |
| Austrians | 98.6 /100 | #70 | Exceptional 16.7% |
| Latvians | 98.5 /100 | #71 | Exceptional 16.7% |
| Immigrants | Canada | 98.5 /100 | #72 | Exceptional 16.7% |
| Lithuanians | 98.2 /100 | #73 | Exceptional 16.7% |