Canadian vs Croatian Unemployment Among Ages 55 to 59 years

COMPARE

Canadian
Race
Ancestry
AfghanAfricanAlaska NativeAlaskan AthabascanAlbanianAleutAlsatianAmericanApacheArabArapahoArgentineanArmenianAssyrian/Chaldean/SyriacAustralianAustrianBahamianBangladeshiBarbadianBasqueBelgianBelizeanBermudanBhutaneseBlackfeetBolivianBrazilianBritishBritish West IndianBulgarianBurmeseCajunCambodianCanadianCape VerdeanCarpatho RusynCelticCentral AmericanCentral American IndianCherokeeCheyenneChickasawChileanChineseChippewaChoctawColombianColvilleComancheCosta RicanCreeCreekCrowCubanCypriotCzechCzechoslovakianDanishDelawareDominicanDutchDutch West IndianEastern EuropeanEcuadorianEgyptianEnglishEstonianEthiopianEuropeanFijianFilipinoFinnishFrenchFrench American IndianFrench CanadianGermanGerman RussianGhanaianGreekGuamanian/ChamorroGuatemalanGuyaneseHaitianHmongHonduranHopiHoumaHungarianIcelanderIndian (Asian)IndonesianInupiatIranianIraqiIrishIroquoisIsraeliItalianJamaicanJapaneseJordanianKenyanKiowaKoreanLaotianLatvianLebaneseLiberianLithuanianLumbeeLuxembourgerMacedonianMalaysianMalteseMarshalleseMenomineeMexicanMexican American IndianMongolianMoroccanNative HawaiianNavajoNepaleseNew ZealanderNicaraguanNigerianNorthern EuropeanNorwegianOkinawanOsageOttawaPaiutePakistaniPalestinianPanamanianParaguayanPennsylvania GermanPeruvianPimaPolishPortuguesePotawatomiPuebloPuerto RicanPuget Sound SalishRomanianRussianSalvadoranSamoanScandinavianScotch-IrishScottishSeminoleSenegaleseSerbianShoshoneSierra LeoneanSiouxSlavicSlovakSloveneSomaliSouth AfricanSouth AmericanSouth American IndianSoviet UnionSpaniardSpanishSpanish AmericanSpanish American IndianSri LankanSubsaharan AfricanSudaneseSwedishSwissSyrianTaiwaneseThaiTlingit-HaidaTohono O'OdhamTonganTrinidadian and TobagonianTsimshianTurkishU.S. Virgin IslanderUgandanUkrainianUruguayanUteVenezuelanVietnameseWelshWest IndianYakamaYaquiYugoslavianYumanYup'ikZimbabwean
Immigration
NonimmigrantsImmigrantsAfghanistanAfricaAlbaniaArgentinaArmeniaAsiaAustraliaAustriaBahamasBangladeshBarbadosBelarusBelgiumBelizeBoliviaBosnia and HerzegovinaBrazilBulgariaBurma/MyanmarCabo VerdeCambodiaCameroonCanadaCaribbeanCentral AmericaChileChinaColombiaCongoCosta RicaCroatiaCubaCzechoslovakiaDenmarkDominicaDominican RepublicEastern AfricaEastern AsiaEastern EuropeEcuadorEgyptEl SalvadorEnglandEritreaEthiopiaEuropeFijiFranceGermanyGhanaGreeceGrenadaGuatemalaGuyanaHaitiHondurasHong KongHungaryIndiaIndonesiaIranIraqIrelandIsraelItalyJamaicaJapanJordanKazakhstanKenyaKoreaKuwaitLaosLatin AmericaLatviaLebanonLiberiaLithuaniaMalaysiaMexicoMicronesiaMiddle AfricaMoldovaMoroccoNepalNetherlandsNicaraguaNigeriaNorth AmericaNorth MacedoniaNorthern AfricaNorthern EuropeNorwayOceaniaPakistanPanamaPeruPhilippinesPolandPortugalRomaniaRussiaSaudi ArabiaScotlandSenegalSerbiaSierra LeoneSingaporeSomaliaSouth AfricaSouth AmericaSouth Central AsiaSouth Eastern AsiaSouthern EuropeSpainSri LankaSt. Vincent and the GrenadinesSudanSwedenSwitzerlandSyriaTaiwanThailandTrinidad and TobagoTurkeyUgandaUkraineUruguayUzbekistanVenezuelaVietnamWest IndiesWestern AfricaWestern AsiaWestern EuropeYemenZaireZimbabweAzores
Croatian
Race
Ancestry
AfghanAfricanAlaska NativeAlaskan AthabascanAlbanianAleutAlsatianAmericanApacheArabArapahoArgentineanArmenianAssyrian/Chaldean/SyriacAustralianAustrianBahamianBangladeshiBarbadianBasqueBelgianBelizeanBermudanBhutaneseBlackfeetBolivianBrazilianBritishBritish West IndianBulgarianBurmeseCajunCambodianCape VerdeanCarpatho RusynCelticCentral AmericanCentral American IndianCherokeeCheyenneChickasawChileanChineseChippewaChoctawColombianColvilleComancheCosta RicanCreeCreekCroatianCrowCubanCypriotCzechCzechoslovakianDanishDelawareDominicanDutchDutch West IndianEastern EuropeanEcuadorianEgyptianEnglishEstonianEthiopianEuropeanFijianFilipinoFinnishFrenchFrench American IndianFrench CanadianGermanGerman RussianGhanaianGreekGuamanian/ChamorroGuatemalanGuyaneseHaitianHmongHonduranHopiHoumaHungarianIcelanderIndian (Asian)IndonesianInupiatIranianIraqiIrishIroquoisIsraeliItalianJamaicanJapaneseJordanianKenyanKiowaKoreanLaotianLatvianLebaneseLiberianLithuanianLumbeeLuxembourgerMacedonianMalaysianMalteseMarshalleseMenomineeMexicanMexican American IndianMongolianMoroccanNative HawaiianNavajoNepaleseNew ZealanderNicaraguanNigerianNorthern EuropeanNorwegianOkinawanOsageOttawaPaiutePakistaniPalestinianPanamanianParaguayanPennsylvania GermanPeruvianPimaPolishPortuguesePotawatomiPuebloPuerto RicanPuget Sound SalishRomanianRussianSalvadoranSamoanScandinavianScotch-IrishScottishSeminoleSenegaleseSerbianShoshoneSierra LeoneanSiouxSlavicSlovakSloveneSomaliSouth AfricanSouth AmericanSouth American IndianSoviet UnionSpaniardSpanishSpanish AmericanSpanish American IndianSri LankanSubsaharan AfricanSudaneseSwedishSwissSyrianTaiwaneseThaiTlingit-HaidaTohono O'OdhamTonganTrinidadian and TobagonianTsimshianTurkishU.S. Virgin IslanderUgandanUkrainianUruguayanUteVenezuelanVietnameseWelshWest IndianYakamaYaquiYugoslavianYumanYup'ikZimbabwean
Immigration
NonimmigrantsImmigrantsAfghanistanAfricaAlbaniaArgentinaArmeniaAsiaAustraliaAustriaBahamasBangladeshBarbadosBelarusBelgiumBelizeBoliviaBosnia and HerzegovinaBrazilBulgariaBurma/MyanmarCabo VerdeCambodiaCameroonCanadaCaribbeanCentral AmericaChileChinaColombiaCongoCosta RicaCroatiaCubaCzechoslovakiaDenmarkDominicaDominican RepublicEastern AfricaEastern AsiaEastern EuropeEcuadorEgyptEl SalvadorEnglandEritreaEthiopiaEuropeFijiFranceGermanyGhanaGreeceGrenadaGuatemalaGuyanaHaitiHondurasHong KongHungaryIndiaIndonesiaIranIraqIrelandIsraelItalyJamaicaJapanJordanKazakhstanKenyaKoreaKuwaitLaosLatin AmericaLatviaLebanonLiberiaLithuaniaMalaysiaMexicoMicronesiaMiddle AfricaMoldovaMoroccoNepalNetherlandsNicaraguaNigeriaNorth AmericaNorth MacedoniaNorthern AfricaNorthern EuropeNorwayOceaniaPakistanPanamaPeruPhilippinesPolandPortugalRomaniaRussiaSaudi ArabiaScotlandSenegalSerbiaSierra LeoneSingaporeSomaliaSouth AfricaSouth AmericaSouth Central AsiaSouth Eastern AsiaSouthern EuropeSpainSri LankaSt. Vincent and the GrenadinesSudanSwedenSwitzerlandSyriaTaiwanThailandTrinidad and TobagoTurkeyUgandaUkraineUruguayUzbekistanVenezuelaVietnamWest IndiesWestern AfricaWestern AsiaWestern EuropeYemenZaireZimbabweAzores
Unemployment Among Ages 55 to 59 years
Income
Poverty
Unemployment
Labor Participation
Family Structure
Vehicle Availability
Education Level
Disability

Unemployment Among Ages 55 to 59 years Comparison

Canadians

Croatians

Exceptional
Exceptional
4.7%
UNEMPLOYMENT AMONG AGES 55 TO 59 YEARS
94.1/ 100
METRIC RATING
102nd/ 347
METRIC RANK
4.6%
UNEMPLOYMENT AMONG AGES 55 TO 59 YEARS
98.5/ 100
METRIC RATING
74th/ 347
METRIC RANK

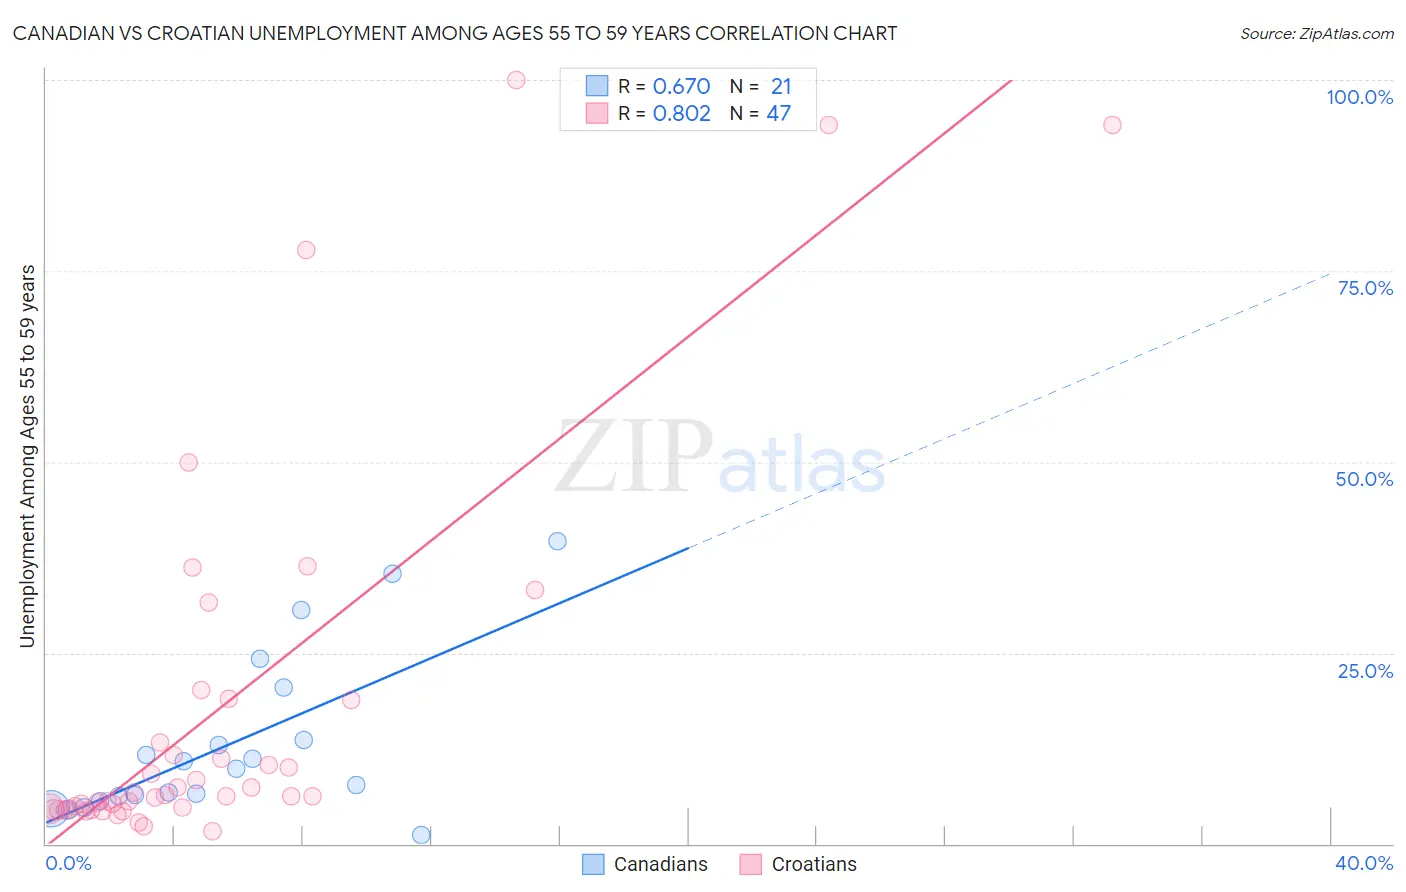
Canadian vs Croatian Unemployment Among Ages 55 to 59 years Correlation Chart

The statistical analysis conducted on geographies consisting of 399,443,838 people shows a significant positive correlation between the proportion of Canadians and unemployment rate among population between the ages 55 and 59 in the United States with a correlation coefficient (R) of 0.670 and weighted average of 4.7%. Similarly, the statistical analysis conducted on geographies consisting of 348,764,859 people shows a very strong positive correlation between the proportion of Croatians and unemployment rate among population between the ages 55 and 59 in the United States with a correlation coefficient (R) of 0.802 and weighted average of 4.6%, a difference of 1.5%.
Canadian vs Croatian Unemployment Among Ages 55 to 59 years

Unemployment Among Ages 55 to 59 years Correlation Summary

MeasurementCanadianCroatian
Minimum1.2%1.7%
Maximum39.6%100.0%
Range38.4%98.3%
Mean13.1%17.5%
Median9.8%6.3%
Interquartile 25% (IQ1)5.9%4.5%
Interquartile 75% (IQ3)17.0%18.8%
Interquartile Range (IQR)11.1%14.3%
Standard Deviation (Sample)10.8%25.2%
Standard Deviation (Population)10.5%24.9%

Similar Demographics by Unemployment Among Ages 55 to 59 years

Demographics Similar to Canadians by Unemployment Among Ages 55 to 59 years

In terms of unemployment among ages 55 to 59 years, the demographic groups most similar to Canadians are Immigrants from Oceania (4.7%, a difference of 0.0%), Immigrants from Turkey (4.7%, a difference of 0.020%), Immigrants from North America (4.7%, a difference of 0.030%), Immigrants from Laos (4.7%, a difference of 0.040%), and Celtic (4.7%, a difference of 0.050%).
DemographicsRating | RankUnemployment Among Ages 55 to 59 years
South Africans
95.6
/100
|
#95
Exceptional
4.7%
Immigrants | Belgium
95.0
/100
|
#96
Exceptional
4.7%
Immigrants | Canada
94.9
/100
|
#97
Exceptional
4.7%
Immigrants | Germany
94.8
/100
|
#98
Exceptional
4.7%
Yugoslavians
94.7
/100
|
#99
Exceptional
4.7%
Serbians
94.4
/100
|
#100
Exceptional
4.7%
Celtics
94.3
/100
|
#101
Exceptional
4.7%
Canadians
94.1
/100
|
#102
Exceptional
4.7%
Immigrants | Oceania
94.0
/100
|
#103
Exceptional
4.7%
Immigrants | Turkey
93.9
/100
|
#104
Exceptional
4.7%
Immigrants | North America
93.9
/100
|
#105
Exceptional
4.7%
Immigrants | Laos
93.9
/100
|
#106
Exceptional
4.7%
Immigrants | Egypt
93.5
/100
|
#107
Exceptional
4.7%
French
93.3
/100
|
#108
Exceptional
4.7%
Chileans
93.2
/100
|
#109
Exceptional
4.7%

Demographics Similar to Croatians by Unemployment Among Ages 55 to 59 years

In terms of unemployment among ages 55 to 59 years, the demographic groups most similar to Croatians are Immigrants from Iraq (4.6%, a difference of 0.020%), Bhutanese (4.6%, a difference of 0.080%), Immigrants from Bosnia and Herzegovina (4.6%, a difference of 0.090%), Scotch-Irish (4.6%, a difference of 0.10%), and Immigrants from Taiwan (4.6%, a difference of 0.15%).
DemographicsRating | RankUnemployment Among Ages 55 to 59 years
Ugandans
99.0
/100
|
#67
Exceptional
4.6%
Immigrants | Micronesia
99.0
/100
|
#68
Exceptional
4.6%
Czechoslovakians
99.0
/100
|
#69
Exceptional
4.6%
Filipinos
98.8
/100
|
#70
Exceptional
4.6%
Immigrants | Jordan
98.7
/100
|
#71
Exceptional
4.6%
Immigrants | Taiwan
98.7
/100
|
#72
Exceptional
4.6%
Bhutanese
98.6
/100
|
#73
Exceptional
4.6%
Croatians
98.5
/100
|
#74
Exceptional
4.6%
Immigrants | Iraq
98.5
/100
|
#75
Exceptional
4.6%
Immigrants | Bosnia and Herzegovina
98.3
/100
|
#76
Exceptional
4.6%
Scotch-Irish
98.3
/100
|
#77
Exceptional
4.6%
Finns
98.2
/100
|
#78
Exceptional
4.6%
Sri Lankans
98.1
/100
|
#79
Exceptional
4.6%
Cambodians
98.0
/100
|
#80
Exceptional
4.6%
Taiwanese
97.9
/100
|
#81
Exceptional
4.6%