Cajun vs Pennsylvania German Unemployment Among Ages 55 to 59 years

COMPARE

Cajun
Race
Ancestry
AfghanAfricanAlaska NativeAlaskan AthabascanAlbanianAleutAlsatianAmericanApacheArabArapahoArgentineanArmenianAssyrian/Chaldean/SyriacAustralianAustrianBahamianBangladeshiBarbadianBasqueBelgianBelizeanBermudanBhutaneseBlackfeetBolivianBrazilianBritishBritish West IndianBulgarianBurmeseCajunCambodianCanadianCape VerdeanCarpatho RusynCelticCentral AmericanCentral American IndianCherokeeCheyenneChickasawChileanChineseChippewaChoctawColombianColvilleComancheCosta RicanCreeCreekCroatianCrowCubanCypriotCzechCzechoslovakianDanishDelawareDominicanDutchDutch West IndianEastern EuropeanEcuadorianEgyptianEnglishEstonianEthiopianEuropeanFijianFilipinoFinnishFrenchFrench American IndianFrench CanadianGermanGerman RussianGhanaianGreekGuamanian/ChamorroGuatemalanGuyaneseHaitianHmongHonduranHopiHoumaHungarianIcelanderIndian (Asian)IndonesianInupiatIranianIraqiIrishIroquoisIsraeliItalianJamaicanJapaneseJordanianKenyanKiowaKoreanLaotianLatvianLebaneseLiberianLithuanianLumbeeLuxembourgerMacedonianMalaysianMalteseMarshalleseMenomineeMexicanMexican American IndianMongolianMoroccanNative HawaiianNavajoNepaleseNew ZealanderNicaraguanNigerianNorthern EuropeanNorwegianOkinawanOsageOttawaPaiutePakistaniPalestinianPanamanianParaguayanPeruvianPimaPolishPortuguesePotawatomiPuebloPuerto RicanPuget Sound SalishRomanianRussianSalvadoranSamoanScandinavianScotch-IrishScottishSeminoleSenegaleseSerbianShoshoneSierra LeoneanSiouxSlavicSlovakSloveneSomaliSouth AfricanSouth AmericanSouth American IndianSoviet UnionSpaniardSpanishSpanish AmericanSpanish American IndianSri LankanSubsaharan AfricanSudaneseSwedishSwissSyrianTaiwaneseThaiTlingit-HaidaTohono O'OdhamTonganTrinidadian and TobagonianTsimshianTurkishU.S. Virgin IslanderUgandanUkrainianUruguayanUteVenezuelanVietnameseWelshWest IndianYakamaYaquiYugoslavianYumanYup'ikZimbabwean
Immigration
NonimmigrantsImmigrantsAfghanistanAfricaAlbaniaArgentinaArmeniaAsiaAustraliaAustriaBahamasBangladeshBarbadosBelarusBelgiumBelizeBoliviaBosnia and HerzegovinaBrazilBulgariaBurma/MyanmarCabo VerdeCambodiaCameroonCanadaCaribbeanCentral AmericaChileChinaColombiaCongoCosta RicaCroatiaCubaCzechoslovakiaDenmarkDominicaDominican RepublicEastern AfricaEastern AsiaEastern EuropeEcuadorEgyptEl SalvadorEnglandEritreaEthiopiaEuropeFijiFranceGermanyGhanaGreeceGrenadaGuatemalaGuyanaHaitiHondurasHong KongHungaryIndiaIndonesiaIranIraqIrelandIsraelItalyJamaicaJapanJordanKazakhstanKenyaKoreaKuwaitLaosLatin AmericaLatviaLebanonLiberiaLithuaniaMalaysiaMexicoMicronesiaMiddle AfricaMoldovaMoroccoNepalNetherlandsNicaraguaNigeriaNorth AmericaNorth MacedoniaNorthern AfricaNorthern EuropeNorwayOceaniaPakistanPanamaPeruPhilippinesPolandPortugalRomaniaRussiaSaudi ArabiaScotlandSenegalSerbiaSierra LeoneSingaporeSomaliaSouth AfricaSouth AmericaSouth Central AsiaSouth Eastern AsiaSouthern EuropeSpainSri LankaSt. Vincent and the GrenadinesSudanSwedenSwitzerlandSyriaTaiwanThailandTrinidad and TobagoTurkeyUgandaUkraineUruguayUzbekistanVenezuelaVietnamWest IndiesWestern AfricaWestern AsiaWestern EuropeYemenZaireZimbabweAzores
Pennsylvania German
Race
Ancestry
AfghanAfricanAlaska NativeAlaskan AthabascanAlbanianAleutAlsatianAmericanApacheArabArapahoArgentineanArmenianAssyrian/Chaldean/SyriacAustralianAustrianBahamianBangladeshiBarbadianBasqueBelgianBelizeanBermudanBhutaneseBlackfeetBolivianBrazilianBritishBritish West IndianBulgarianBurmeseCambodianCanadianCape VerdeanCarpatho RusynCelticCentral AmericanCentral American IndianCherokeeCheyenneChickasawChileanChineseChippewaChoctawColombianColvilleComancheCosta RicanCreeCreekCroatianCrowCubanCypriotCzechCzechoslovakianDanishDelawareDominicanDutchDutch West IndianEastern EuropeanEcuadorianEgyptianEnglishEstonianEthiopianEuropeanFijianFilipinoFinnishFrenchFrench American IndianFrench CanadianGermanGerman RussianGhanaianGreekGuamanian/ChamorroGuatemalanGuyaneseHaitianHmongHonduranHopiHoumaHungarianIcelanderIndian (Asian)IndonesianInupiatIranianIraqiIrishIroquoisIsraeliItalianJamaicanJapaneseJordanianKenyanKiowaKoreanLaotianLatvianLebaneseLiberianLithuanianLumbeeLuxembourgerMacedonianMalaysianMalteseMarshalleseMenomineeMexicanMexican American IndianMongolianMoroccanNative HawaiianNavajoNepaleseNew ZealanderNicaraguanNigerianNorthern EuropeanNorwegianOkinawanOsageOttawaPaiutePakistaniPalestinianPanamanianParaguayanPennsylvania GermanPeruvianPimaPolishPortuguesePotawatomiPuebloPuerto RicanPuget Sound SalishRomanianRussianSalvadoranSamoanScandinavianScotch-IrishScottishSeminoleSenegaleseSerbianShoshoneSierra LeoneanSiouxSlavicSlovakSloveneSomaliSouth AfricanSouth AmericanSouth American IndianSoviet UnionSpaniardSpanishSpanish AmericanSpanish American IndianSri LankanSubsaharan AfricanSudaneseSwedishSwissSyrianTaiwaneseThaiTlingit-HaidaTohono O'OdhamTonganTrinidadian and TobagonianTsimshianTurkishU.S. Virgin IslanderUgandanUkrainianUruguayanUteVenezuelanVietnameseWelshWest IndianYakamaYaquiYugoslavianYumanYup'ikZimbabwean
Immigration
NonimmigrantsImmigrantsAfghanistanAfricaAlbaniaArgentinaArmeniaAsiaAustraliaAustriaBahamasBangladeshBarbadosBelarusBelgiumBelizeBoliviaBosnia and HerzegovinaBrazilBulgariaBurma/MyanmarCabo VerdeCambodiaCameroonCanadaCaribbeanCentral AmericaChileChinaColombiaCongoCosta RicaCroatiaCubaCzechoslovakiaDenmarkDominicaDominican RepublicEastern AfricaEastern AsiaEastern EuropeEcuadorEgyptEl SalvadorEnglandEritreaEthiopiaEuropeFijiFranceGermanyGhanaGreeceGrenadaGuatemalaGuyanaHaitiHondurasHong KongHungaryIndiaIndonesiaIranIraqIrelandIsraelItalyJamaicaJapanJordanKazakhstanKenyaKoreaKuwaitLaosLatin AmericaLatviaLebanonLiberiaLithuaniaMalaysiaMexicoMicronesiaMiddle AfricaMoldovaMoroccoNepalNetherlandsNicaraguaNigeriaNorth AmericaNorth MacedoniaNorthern AfricaNorthern EuropeNorwayOceaniaPakistanPanamaPeruPhilippinesPolandPortugalRomaniaRussiaSaudi ArabiaScotlandSenegalSerbiaSierra LeoneSingaporeSomaliaSouth AfricaSouth AmericaSouth Central AsiaSouth Eastern AsiaSouthern EuropeSpainSri LankaSt. Vincent and the GrenadinesSudanSwedenSwitzerlandSyriaTaiwanThailandTrinidad and TobagoTurkeyUgandaUkraineUruguayUzbekistanVenezuelaVietnamWest IndiesWestern AfricaWestern AsiaWestern EuropeYemenZaireZimbabweAzores
Unemployment Among Ages 55 to 59 years
Income
Poverty
Unemployment
Labor Participation
Family Structure
Vehicle Availability
Education Level
Disability

Unemployment Among Ages 55 to 59 years Comparison

Cajuns

Pennsylvania Germans

Tragic
Excellent
5.3%
UNEMPLOYMENT AMONG AGES 55 TO 59 YEARS
0.0/ 100
METRIC RATING
294th/ 347
METRIC RANK
4.7%
UNEMPLOYMENT AMONG AGES 55 TO 59 YEARS
87.1/ 100
METRIC RATING
128th/ 347
METRIC RANK

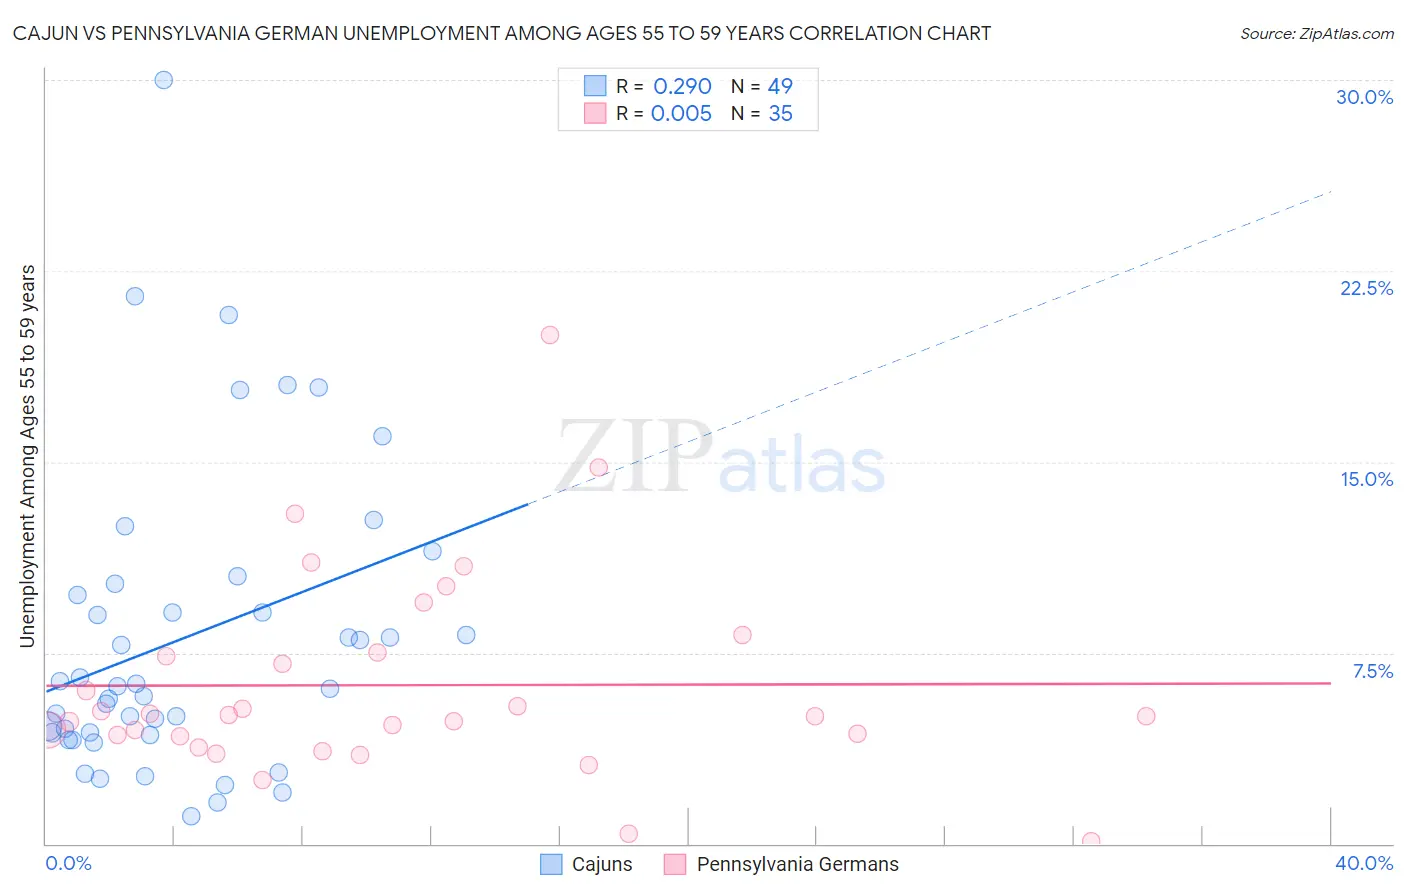
Cajun vs Pennsylvania German Unemployment Among Ages 55 to 59 years Correlation Chart

The statistical analysis conducted on geographies consisting of 141,735,204 people shows a weak positive correlation between the proportion of Cajuns and unemployment rate among population between the ages 55 and 59 in the United States with a correlation coefficient (R) of 0.290 and weighted average of 5.3%. Similarly, the statistical analysis conducted on geographies consisting of 218,034,331 people shows no correlation between the proportion of Pennsylvania Germans and unemployment rate among population between the ages 55 and 59 in the United States with a correlation coefficient (R) of 0.005 and weighted average of 4.7%, a difference of 12.7%.
Cajun vs Pennsylvania German Unemployment Among Ages 55 to 59 years

Unemployment Among Ages 55 to 59 years Correlation Summary

MeasurementCajunPennsylvania German
Minimum1.1%0.10%
Maximum30.0%20.0%
Range28.9%19.9%
Mean8.1%6.2%
Median6.2%5.0%
Interquartile 25% (IQ1)4.3%4.2%
Interquartile 75% (IQ3)10.0%7.5%
Interquartile Range (IQR)5.7%3.3%
Standard Deviation (Sample)6.0%4.0%
Standard Deviation (Population)5.9%3.9%

Similar Demographics by Unemployment Among Ages 55 to 59 years

Demographics Similar to Cajuns by Unemployment Among Ages 55 to 59 years

In terms of unemployment among ages 55 to 59 years, the demographic groups most similar to Cajuns are Immigrants from Grenada (5.3%, a difference of 0.12%), Dutch West Indian (5.3%, a difference of 0.12%), Barbadian (5.3%, a difference of 0.16%), British West Indian (5.3%, a difference of 0.31%), and Immigrants from Mexico (5.3%, a difference of 0.38%).
DemographicsRating | RankUnemployment Among Ages 55 to 59 years
Immigrants | Guatemala
0.0
/100
|
#287
Tragic
5.3%
Immigrants | Israel
0.0
/100
|
#288
Tragic
5.3%
Immigrants | Central America
0.0
/100
|
#289
Tragic
5.3%
Sioux
0.0
/100
|
#290
Tragic
5.3%
Trinidadians and Tobagonians
0.0
/100
|
#291
Tragic
5.3%
British West Indians
0.0
/100
|
#292
Tragic
5.3%
Immigrants | Grenada
0.0
/100
|
#293
Tragic
5.3%
Cajuns
0.0
/100
|
#294
Tragic
5.3%
Dutch West Indians
0.0
/100
|
#295
Tragic
5.3%
Barbadians
0.0
/100
|
#296
Tragic
5.3%
Immigrants | Mexico
0.0
/100
|
#297
Tragic
5.3%
Hispanics or Latinos
0.0
/100
|
#298
Tragic
5.4%
Cape Verdeans
0.0
/100
|
#299
Tragic
5.4%
Immigrants | St. Vincent and the Grenadines
0.0
/100
|
#300
Tragic
5.4%
Immigrants | Dominica
0.0
/100
|
#301
Tragic
5.5%

Demographics Similar to Pennsylvania Germans by Unemployment Among Ages 55 to 59 years

In terms of unemployment among ages 55 to 59 years, the demographic groups most similar to Pennsylvania Germans are Immigrants from Sweden (4.7%, a difference of 0.030%), Greek (4.7%, a difference of 0.040%), Icelander (4.7%, a difference of 0.050%), Immigrants from Serbia (4.7%, a difference of 0.060%), and Immigrants from Malaysia (4.7%, a difference of 0.080%).
DemographicsRating | RankUnemployment Among Ages 55 to 59 years
Pakistanis
89.7
/100
|
#121
Excellent
4.7%
Immigrants | Afghanistan
89.5
/100
|
#122
Excellent
4.7%
Immigrants | Japan
89.4
/100
|
#123
Excellent
4.7%
Lithuanians
88.8
/100
|
#124
Excellent
4.7%
Immigrants | Malaysia
87.9
/100
|
#125
Excellent
4.7%
Immigrants | Serbia
87.8
/100
|
#126
Excellent
4.7%
Icelanders
87.7
/100
|
#127
Excellent
4.7%
Pennsylvania Germans
87.1
/100
|
#128
Excellent
4.7%
Immigrants | Sweden
86.8
/100
|
#129
Excellent
4.7%
Greeks
86.6
/100
|
#130
Excellent
4.7%
Immigrants | Thailand
85.4
/100
|
#131
Excellent
4.7%
Immigrants | Romania
85.3
/100
|
#132
Excellent
4.7%
Immigrants | Netherlands
84.5
/100
|
#133
Excellent
4.7%
Panamanians
84.1
/100
|
#134
Excellent
4.7%
Slavs
83.7
/100
|
#135
Excellent
4.7%