Burmese vs Cherokee Unemployment Among Youth under 25 years

COMPARE

Burmese
Race
Ancestry
AfghanAfricanAlaska NativeAlaskan AthabascanAlbanianAleutAlsatianAmericanApacheArabArapahoArgentineanArmenianAssyrian/Chaldean/SyriacAustralianAustrianBahamianBangladeshiBarbadianBasqueBelgianBelizeanBermudanBhutaneseBlackfeetBolivianBrazilianBritishBritish West IndianBulgarianBurmeseCajunCambodianCanadianCape VerdeanCarpatho RusynCelticCentral AmericanCentral American IndianCheyenneChickasawChileanChineseChippewaChoctawColombianColvilleComancheCosta RicanCreeCreekCroatianCrowCubanCypriotCzechCzechoslovakianDanishDelawareDominicanDutchDutch West IndianEastern EuropeanEcuadorianEgyptianEnglishEstonianEthiopianEuropeanFijianFilipinoFinnishFrenchFrench American IndianFrench CanadianGermanGerman RussianGhanaianGreekGuamanian/ChamorroGuatemalanGuyaneseHaitianHmongHonduranHopiHoumaHungarianIcelanderIndian (Asian)IndonesianInupiatIranianIraqiIrishIroquoisIsraeliItalianJamaicanJapaneseJordanianKenyanKiowaKoreanLaotianLatvianLebaneseLiberianLithuanianLumbeeLuxembourgerMacedonianMalaysianMalteseMarshalleseMenomineeMexicanMexican American IndianMongolianMoroccanNative HawaiianNavajoNepaleseNew ZealanderNicaraguanNigerianNorthern EuropeanNorwegianOkinawanOsageOttawaPaiutePakistaniPalestinianPanamanianParaguayanPennsylvania GermanPeruvianPimaPolishPortuguesePotawatomiPuebloPuerto RicanPuget Sound SalishRomanianRussianSalvadoranSamoanScandinavianScotch-IrishScottishSeminoleSenegaleseSerbianShoshoneSierra LeoneanSiouxSlavicSlovakSloveneSomaliSouth AfricanSouth AmericanSouth American IndianSoviet UnionSpaniardSpanishSpanish AmericanSpanish American IndianSri LankanSubsaharan AfricanSudaneseSwedishSwissSyrianTaiwaneseThaiTlingit-HaidaTohono O'OdhamTonganTrinidadian and TobagonianTsimshianTurkishU.S. Virgin IslanderUgandanUkrainianUruguayanUteVenezuelanVietnameseWelshWest IndianYakamaYaquiYugoslavianYumanYup'ikZimbabwean
Immigration
NonimmigrantsImmigrantsAfghanistanAfricaAlbaniaArgentinaArmeniaAsiaAustraliaAustriaBahamasBangladeshBarbadosBelarusBelgiumBelizeBoliviaBosnia and HerzegovinaBrazilBulgariaBurma/MyanmarCabo VerdeCambodiaCameroonCanadaCaribbeanCentral AmericaChileChinaColombiaCongoCosta RicaCroatiaCubaCzechoslovakiaDenmarkDominicaDominican RepublicEastern AfricaEastern AsiaEastern EuropeEcuadorEgyptEl SalvadorEnglandEritreaEthiopiaEuropeFijiFranceGermanyGhanaGreeceGrenadaGuatemalaGuyanaHaitiHondurasHong KongHungaryIndiaIndonesiaIranIraqIrelandIsraelItalyJamaicaJapanJordanKazakhstanKenyaKoreaKuwaitLaosLatin AmericaLatviaLebanonLiberiaLithuaniaMalaysiaMexicoMicronesiaMiddle AfricaMoldovaMoroccoNepalNetherlandsNicaraguaNigeriaNorth AmericaNorth MacedoniaNorthern AfricaNorthern EuropeNorwayOceaniaPakistanPanamaPeruPhilippinesPolandPortugalRomaniaRussiaSaudi ArabiaScotlandSenegalSerbiaSierra LeoneSingaporeSomaliaSouth AfricaSouth AmericaSouth Central AsiaSouth Eastern AsiaSouthern EuropeSpainSri LankaSt. Vincent and the GrenadinesSudanSwedenSwitzerlandSyriaTaiwanThailandTrinidad and TobagoTurkeyUgandaUkraineUruguayUzbekistanVenezuelaVietnamWest IndiesWestern AfricaWestern AsiaWestern EuropeYemenZaireZimbabweAzores
Cherokee
Race
Ancestry
AfghanAfricanAlaska NativeAlaskan AthabascanAlbanianAleutAlsatianAmericanApacheArabArapahoArgentineanArmenianAssyrian/Chaldean/SyriacAustralianAustrianBahamianBangladeshiBarbadianBasqueBelgianBelizeanBermudanBhutaneseBlackfeetBolivianBrazilianBritishBritish West IndianBulgarianCajunCambodianCanadianCape VerdeanCarpatho RusynCelticCentral AmericanCentral American IndianCherokeeCheyenneChickasawChileanChineseChippewaChoctawColombianColvilleComancheCosta RicanCreeCreekCroatianCrowCubanCypriotCzechCzechoslovakianDanishDelawareDominicanDutchDutch West IndianEastern EuropeanEcuadorianEgyptianEnglishEstonianEthiopianEuropeanFijianFilipinoFinnishFrenchFrench American IndianFrench CanadianGermanGerman RussianGhanaianGreekGuamanian/ChamorroGuatemalanGuyaneseHaitianHmongHonduranHopiHoumaHungarianIcelanderIndian (Asian)IndonesianInupiatIranianIraqiIrishIroquoisIsraeliItalianJamaicanJapaneseJordanianKenyanKiowaKoreanLaotianLatvianLebaneseLiberianLithuanianLumbeeLuxembourgerMacedonianMalaysianMalteseMarshalleseMenomineeMexicanMexican American IndianMongolianMoroccanNative HawaiianNavajoNepaleseNew ZealanderNicaraguanNigerianNorthern EuropeanNorwegianOkinawanOsageOttawaPaiutePakistaniPalestinianPanamanianParaguayanPennsylvania GermanPeruvianPimaPolishPortuguesePotawatomiPuebloPuerto RicanPuget Sound SalishRomanianRussianSalvadoranSamoanScandinavianScotch-IrishScottishSeminoleSenegaleseSerbianShoshoneSierra LeoneanSiouxSlavicSlovakSloveneSomaliSouth AfricanSouth AmericanSouth American IndianSoviet UnionSpaniardSpanishSpanish AmericanSpanish American IndianSri LankanSubsaharan AfricanSudaneseSwedishSwissSyrianTaiwaneseThaiTlingit-HaidaTohono O'OdhamTonganTrinidadian and TobagonianTsimshianTurkishU.S. Virgin IslanderUgandanUkrainianUruguayanUteVenezuelanVietnameseWelshWest IndianYakamaYaquiYugoslavianYumanYup'ikZimbabwean
Immigration
NonimmigrantsImmigrantsAfghanistanAfricaAlbaniaArgentinaArmeniaAsiaAustraliaAustriaBahamasBangladeshBarbadosBelarusBelgiumBelizeBoliviaBosnia and HerzegovinaBrazilBulgariaBurma/MyanmarCabo VerdeCambodiaCameroonCanadaCaribbeanCentral AmericaChileChinaColombiaCongoCosta RicaCroatiaCubaCzechoslovakiaDenmarkDominicaDominican RepublicEastern AfricaEastern AsiaEastern EuropeEcuadorEgyptEl SalvadorEnglandEritreaEthiopiaEuropeFijiFranceGermanyGhanaGreeceGrenadaGuatemalaGuyanaHaitiHondurasHong KongHungaryIndiaIndonesiaIranIraqIrelandIsraelItalyJamaicaJapanJordanKazakhstanKenyaKoreaKuwaitLaosLatin AmericaLatviaLebanonLiberiaLithuaniaMalaysiaMexicoMicronesiaMiddle AfricaMoldovaMoroccoNepalNetherlandsNicaraguaNigeriaNorth AmericaNorth MacedoniaNorthern AfricaNorthern EuropeNorwayOceaniaPakistanPanamaPeruPhilippinesPolandPortugalRomaniaRussiaSaudi ArabiaScotlandSenegalSerbiaSierra LeoneSingaporeSomaliaSouth AfricaSouth AmericaSouth Central AsiaSouth Eastern AsiaSouthern EuropeSpainSri LankaSt. Vincent and the GrenadinesSudanSwedenSwitzerlandSyriaTaiwanThailandTrinidad and TobagoTurkeyUgandaUkraineUruguayUzbekistanVenezuelaVietnamWest IndiesWestern AfricaWestern AsiaWestern EuropeYemenZaireZimbabweAzores
Unemployment Among Youth under 25 years
Income
Poverty
Unemployment
Labor Participation
Family Structure
Vehicle Availability
Education Level
Disability

Unemployment Among Youth under 25 years Comparison

Burmese

Cherokee

Excellent
Fair
11.3%
UNEMPLOYMENT AMONG YOUTH UNDER 25 YEARS
89.8/ 100
METRIC RATING
116th/ 347
METRIC RANK
11.8%
UNEMPLOYMENT AMONG YOUTH UNDER 25 YEARS
21.2/ 100
METRIC RATING
198th/ 347
METRIC RANK

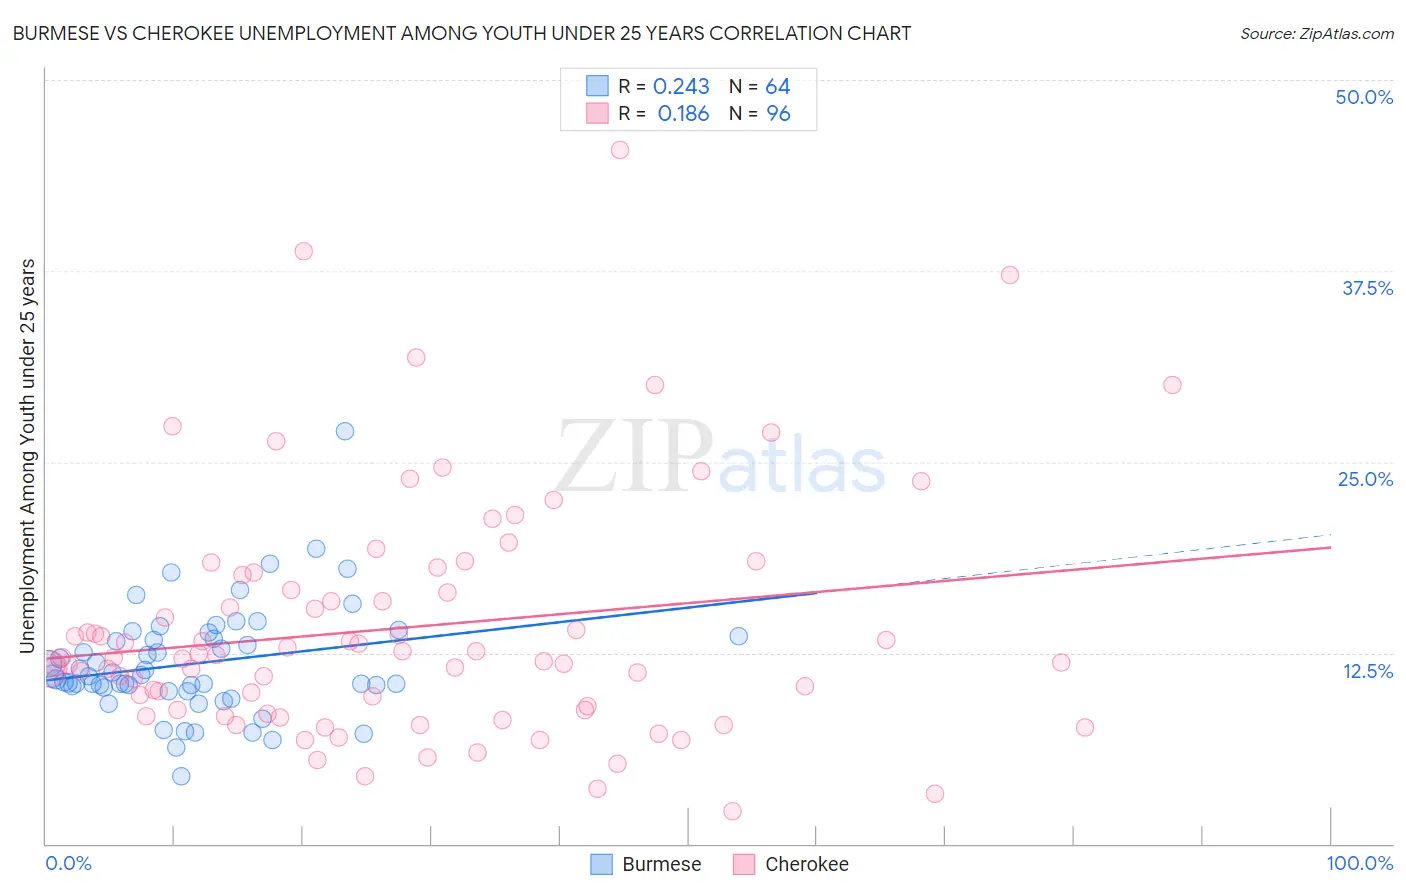
Burmese vs Cherokee Unemployment Among Youth under 25 years Correlation Chart

The statistical analysis conducted on geographies consisting of 457,894,407 people shows a weak positive correlation between the proportion of Burmese and unemployment rate among youth under the age of 25 in the United States with a correlation coefficient (R) of 0.243 and weighted average of 11.3%. Similarly, the statistical analysis conducted on geographies consisting of 481,576,104 people shows a poor positive correlation between the proportion of Cherokee and unemployment rate among youth under the age of 25 in the United States with a correlation coefficient (R) of 0.186 and weighted average of 11.8%, a difference of 3.7%.
Burmese vs Cherokee Unemployment Among Youth under 25 years

Unemployment Among Youth under 25 years Correlation Summary

MeasurementBurmeseCherokee
Minimum4.4%2.1%
Maximum27.0%45.4%
Range22.6%43.3%
Mean11.8%14.2%
Median11.0%12.2%
Interquartile 25% (IQ1)10.3%8.8%
Interquartile 75% (IQ3)13.5%17.1%
Interquartile Range (IQR)3.2%8.3%
Standard Deviation (Sample)3.6%7.9%
Standard Deviation (Population)3.5%7.8%

Similar Demographics by Unemployment Among Youth under 25 years

Demographics Similar to Burmese by Unemployment Among Youth under 25 years

In terms of unemployment among youth under 25 years, the demographic groups most similar to Burmese are Immigrants from Vietnam (11.3%, a difference of 0.010%), Sri Lankan (11.3%, a difference of 0.010%), Afghan (11.3%, a difference of 0.010%), Immigrants from Ethiopia (11.3%, a difference of 0.020%), and Fijian (11.3%, a difference of 0.050%).
DemographicsRating | RankUnemployment Among Youth under 25 years
Iranians
92.0
/100
|
#109
Exceptional
11.3%
Immigrants | Norway
91.5
/100
|
#110
Exceptional
11.3%
Immigrants | France
90.3
/100
|
#111
Exceptional
11.3%
Immigrants | Austria
90.3
/100
|
#112
Exceptional
11.3%
Fijians
90.2
/100
|
#113
Exceptional
11.3%
Immigrants | Ethiopia
89.9
/100
|
#114
Excellent
11.3%
Immigrants | Vietnam
89.9
/100
|
#115
Excellent
11.3%
Burmese
89.8
/100
|
#116
Excellent
11.3%
Sri Lankans
89.8
/100
|
#117
Excellent
11.3%
Afghans
89.7
/100
|
#118
Excellent
11.3%
Immigrants | Scotland
89.2
/100
|
#119
Excellent
11.4%
Malaysians
89.0
/100
|
#120
Excellent
11.4%
Slovaks
88.9
/100
|
#121
Excellent
11.4%
Immigrants | Micronesia
88.1
/100
|
#122
Excellent
11.4%
Basques
87.8
/100
|
#123
Excellent
11.4%

Demographics Similar to Cherokee by Unemployment Among Youth under 25 years

In terms of unemployment among youth under 25 years, the demographic groups most similar to Cherokee are Immigrants from Colombia (11.8%, a difference of 0.020%), Korean (11.7%, a difference of 0.16%), Arab (11.8%, a difference of 0.20%), Egyptian (11.7%, a difference of 0.32%), and Paraguayan (11.7%, a difference of 0.33%).
DemographicsRating | RankUnemployment Among Youth under 25 years
Cypriots
28.5
/100
|
#191
Fair
11.7%
Immigrants | Russia
28.5
/100
|
#192
Fair
11.7%
Seminole
27.9
/100
|
#193
Fair
11.7%
Immigrants | Sri Lanka
27.8
/100
|
#194
Fair
11.7%
Paraguayans
27.2
/100
|
#195
Fair
11.7%
Egyptians
26.9
/100
|
#196
Fair
11.7%
Koreans
23.9
/100
|
#197
Fair
11.7%
Cherokee
21.2
/100
|
#198
Fair
11.8%
Immigrants | Colombia
20.9
/100
|
#199
Fair
11.8%
Arabs
18.0
/100
|
#200
Poor
11.8%
Palestinians
16.0
/100
|
#201
Poor
11.8%
Marshallese
15.8
/100
|
#202
Poor
11.8%
Immigrants | Peru
15.3
/100
|
#203
Poor
11.8%
Immigrants | Costa Rica
15.2
/100
|
#204
Poor
11.8%
Peruvians
14.0
/100
|
#205
Poor
11.8%