Bulgarian vs Soviet Union Unemployment Among Ages 30 to 34 years

COMPARE

Bulgarian
Race
Ancestry
AfghanAfricanAlaska NativeAlaskan AthabascanAlbanianAleutAlsatianAmericanApacheArabArapahoArgentineanArmenianAssyrian/Chaldean/SyriacAustralianAustrianBahamianBangladeshiBarbadianBasqueBelgianBelizeanBermudanBhutaneseBlackfeetBolivianBrazilianBritishBritish West IndianBulgarianBurmeseCajunCambodianCanadianCape VerdeanCarpatho RusynCelticCentral AmericanCentral American IndianCherokeeCheyenneChickasawChileanChineseChippewaChoctawColombianColvilleComancheCosta RicanCreeCreekCroatianCrowCubanCypriotCzechCzechoslovakianDanishDelawareDominicanDutchDutch West IndianEastern EuropeanEcuadorianEgyptianEnglishEstonianEthiopianEuropeanFijianFilipinoFinnishFrenchFrench American IndianFrench CanadianGermanGerman RussianGhanaianGreekGuamanian/ChamorroGuatemalanGuyaneseHaitianHmongHonduranHopiHoumaHungarianIcelanderIndian (Asian)IndonesianInupiatIranianIraqiIrishIroquoisIsraeliItalianJamaicanJapaneseJordanianKenyanKiowaKoreanLaotianLatvianLebaneseLiberianLithuanianLumbeeLuxembourgerMacedonianMalaysianMalteseMarshalleseMenomineeMexicanMexican American IndianMongolianMoroccanNative HawaiianNavajoNepaleseNew ZealanderNicaraguanNigerianNorthern EuropeanNorwegianOkinawanOsageOttawaPaiutePakistaniPalestinianPanamanianParaguayanPennsylvania GermanPeruvianPimaPolishPortuguesePotawatomiPuebloPuerto RicanPuget Sound SalishRomanianRussianSalvadoranSamoanScandinavianScotch-IrishScottishSeminoleSenegaleseSerbianShoshoneSierra LeoneanSiouxSlavicSlovakSloveneSomaliSouth AfricanSouth AmericanSouth American IndianSpaniardSpanishSpanish AmericanSpanish American IndianSri LankanSubsaharan AfricanSudaneseSwedishSwissSyrianTaiwaneseThaiTlingit-HaidaTohono O'OdhamTonganTrinidadian and TobagonianTsimshianTurkishU.S. Virgin IslanderUgandanUkrainianUruguayanUteVenezuelanVietnameseWelshWest IndianYakamaYaquiYugoslavianYumanYup'ikZimbabwean
Immigration
NonimmigrantsImmigrantsAfghanistanAfricaAlbaniaArgentinaArmeniaAsiaAustraliaAustriaBahamasBangladeshBarbadosBelarusBelgiumBelizeBoliviaBosnia and HerzegovinaBrazilBulgariaBurma/MyanmarCabo VerdeCambodiaCameroonCanadaCaribbeanCentral AmericaChileChinaColombiaCongoCosta RicaCroatiaCubaCzechoslovakiaDenmarkDominicaDominican RepublicEastern AfricaEastern AsiaEastern EuropeEcuadorEgyptEl SalvadorEnglandEritreaEthiopiaEuropeFijiFranceGermanyGhanaGreeceGrenadaGuatemalaGuyanaHaitiHondurasHong KongHungaryIndiaIndonesiaIranIraqIrelandIsraelItalyJamaicaJapanJordanKazakhstanKenyaKoreaKuwaitLaosLatin AmericaLatviaLebanonLiberiaLithuaniaMalaysiaMexicoMicronesiaMiddle AfricaMoldovaMoroccoNepalNetherlandsNicaraguaNigeriaNorth AmericaNorth MacedoniaNorthern AfricaNorthern EuropeNorwayOceaniaPakistanPanamaPeruPhilippinesPolandPortugalRomaniaRussiaSaudi ArabiaScotlandSenegalSerbiaSierra LeoneSingaporeSomaliaSouth AfricaSouth AmericaSouth Central AsiaSouth Eastern AsiaSouthern EuropeSpainSri LankaSt. Vincent and the GrenadinesSudanSwedenSwitzerlandSyriaTaiwanThailandTrinidad and TobagoTurkeyUgandaUkraineUruguayUzbekistanVenezuelaVietnamWest IndiesWestern AfricaWestern AsiaWestern EuropeYemenZaireZimbabweAzores
Soviet Union
Race
Ancestry
AfghanAfricanAlaska NativeAlaskan AthabascanAlbanianAleutAlsatianAmericanApacheArabArapahoArgentineanArmenianAssyrian/Chaldean/SyriacAustralianAustrianBahamianBangladeshiBarbadianBasqueBelgianBelizeanBermudanBhutaneseBlackfeetBolivianBrazilianBritishBritish West IndianBurmeseCajunCambodianCanadianCape VerdeanCarpatho RusynCelticCentral AmericanCentral American IndianCherokeeCheyenneChickasawChileanChineseChippewaChoctawColombianColvilleComancheCosta RicanCreeCreekCroatianCrowCubanCypriotCzechCzechoslovakianDanishDelawareDominicanDutchDutch West IndianEastern EuropeanEcuadorianEgyptianEnglishEstonianEthiopianEuropeanFijianFilipinoFinnishFrenchFrench American IndianFrench CanadianGermanGerman RussianGhanaianGreekGuamanian/ChamorroGuatemalanGuyaneseHaitianHmongHonduranHopiHoumaHungarianIcelanderIndian (Asian)IndonesianInupiatIranianIraqiIrishIroquoisIsraeliItalianJamaicanJapaneseJordanianKenyanKiowaKoreanLaotianLatvianLebaneseLiberianLithuanianLumbeeLuxembourgerMacedonianMalaysianMalteseMarshalleseMenomineeMexicanMexican American IndianMongolianMoroccanNative HawaiianNavajoNepaleseNew ZealanderNicaraguanNigerianNorthern EuropeanNorwegianOkinawanOsageOttawaPaiutePakistaniPalestinianPanamanianParaguayanPennsylvania GermanPeruvianPimaPolishPortuguesePotawatomiPuebloPuerto RicanPuget Sound SalishRomanianRussianSalvadoranSamoanScandinavianScotch-IrishScottishSeminoleSenegaleseSerbianShoshoneSierra LeoneanSiouxSlavicSlovakSloveneSomaliSouth AfricanSouth AmericanSouth American IndianSoviet UnionSpaniardSpanishSpanish AmericanSpanish American IndianSri LankanSubsaharan AfricanSudaneseSwedishSwissSyrianTaiwaneseThaiTlingit-HaidaTohono O'OdhamTonganTrinidadian and TobagonianTsimshianTurkishU.S. Virgin IslanderUgandanUkrainianUruguayanUteVenezuelanVietnameseWelshWest IndianYakamaYaquiYugoslavianYumanYup'ikZimbabwean
Immigration
NonimmigrantsImmigrantsAfghanistanAfricaAlbaniaArgentinaArmeniaAsiaAustraliaAustriaBahamasBangladeshBarbadosBelarusBelgiumBelizeBoliviaBosnia and HerzegovinaBrazilBulgariaBurma/MyanmarCabo VerdeCambodiaCameroonCanadaCaribbeanCentral AmericaChileChinaColombiaCongoCosta RicaCroatiaCubaCzechoslovakiaDenmarkDominicaDominican RepublicEastern AfricaEastern AsiaEastern EuropeEcuadorEgyptEl SalvadorEnglandEritreaEthiopiaEuropeFijiFranceGermanyGhanaGreeceGrenadaGuatemalaGuyanaHaitiHondurasHong KongHungaryIndiaIndonesiaIranIraqIrelandIsraelItalyJamaicaJapanJordanKazakhstanKenyaKoreaKuwaitLaosLatin AmericaLatviaLebanonLiberiaLithuaniaMalaysiaMexicoMicronesiaMiddle AfricaMoldovaMoroccoNepalNetherlandsNicaraguaNigeriaNorth AmericaNorth MacedoniaNorthern AfricaNorthern EuropeNorwayOceaniaPakistanPanamaPeruPhilippinesPolandPortugalRomaniaRussiaSaudi ArabiaScotlandSenegalSerbiaSierra LeoneSingaporeSomaliaSouth AfricaSouth AmericaSouth Central AsiaSouth Eastern AsiaSouthern EuropeSpainSri LankaSt. Vincent and the GrenadinesSudanSwedenSwitzerlandSyriaTaiwanThailandTrinidad and TobagoTurkeyUgandaUkraineUruguayUzbekistanVenezuelaVietnamWest IndiesWestern AfricaWestern AsiaWestern EuropeYemenZaireZimbabweAzores
Unemployment Among Ages 30 to 34 years
Income
Poverty
Unemployment
Labor Participation
Family Structure
Vehicle Availability
Education Level
Disability

Unemployment Among Ages 30 to 34 years Comparison

Bulgarians

Soviet Union

Exceptional
Exceptional
4.7%
UNEMPLOYMENT AMONG AGES 30 TO 34 YEARS
99.9/ 100
METRIC RATING
9th/ 347
METRIC RANK
5.0%
UNEMPLOYMENT AMONG AGES 30 TO 34 YEARS
98.8/ 100
METRIC RATING
43rd/ 347
METRIC RANK

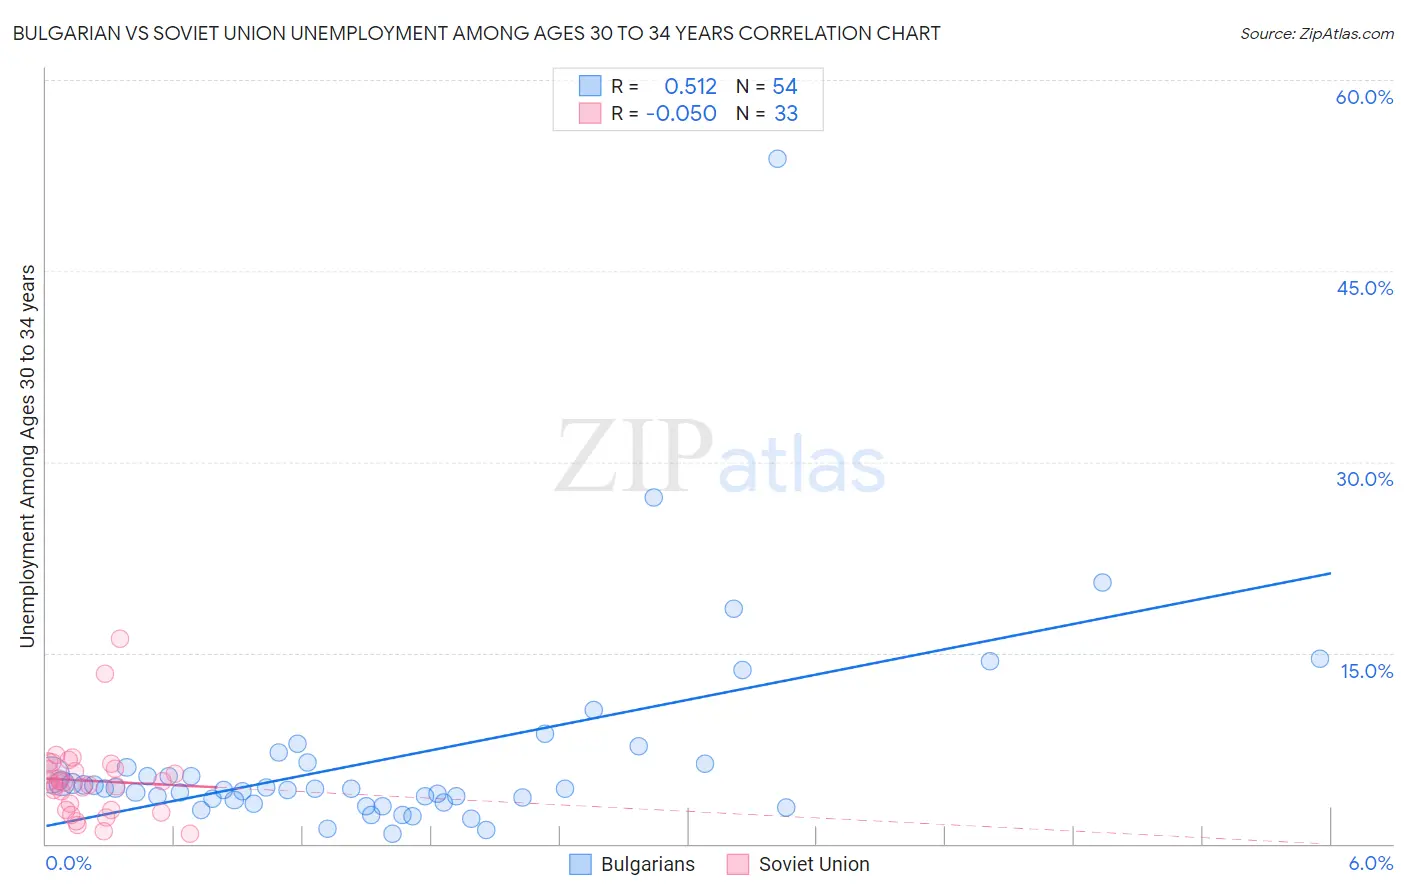
Bulgarian vs Soviet Union Unemployment Among Ages 30 to 34 years Correlation Chart

The statistical analysis conducted on geographies consisting of 198,602,518 people shows a substantial positive correlation between the proportion of Bulgarians and unemployment rate among population between the ages 30 and 34 in the United States with a correlation coefficient (R) of 0.512 and weighted average of 4.7%. Similarly, the statistical analysis conducted on geographies consisting of 43,078,343 people shows a slight negative correlation between the proportion of Soviet Union and unemployment rate among population between the ages 30 and 34 in the United States with a correlation coefficient (R) of -0.050 and weighted average of 5.0%, a difference of 6.4%.
Bulgarian vs Soviet Union Unemployment Among Ages 30 to 34 years

Unemployment Among Ages 30 to 34 years Correlation Summary

MeasurementBulgarianSoviet Union
Minimum0.80%0.80%
Maximum53.8%16.1%
Range53.0%15.3%
Mean6.8%4.9%
Median4.3%4.8%
Interquartile 25% (IQ1)3.5%2.7%
Interquartile 75% (IQ3)6.3%6.1%
Interquartile Range (IQR)2.8%3.4%
Standard Deviation (Sample)8.2%3.1%
Standard Deviation (Population)8.1%3.0%

Similar Demographics by Unemployment Among Ages 30 to 34 years

Demographics Similar to Bulgarians by Unemployment Among Ages 30 to 34 years

In terms of unemployment among ages 30 to 34 years, the demographic groups most similar to Bulgarians are Tongan (4.8%, a difference of 0.18%), Immigrants from Bolivia (4.8%, a difference of 0.21%), Immigrants from Eritrea (4.7%, a difference of 0.31%), Thai (4.7%, a difference of 0.49%), and Immigrants from Bosnia and Herzegovina (4.7%, a difference of 0.69%).
DemographicsRating | RankUnemployment Among Ages 30 to 34 years
Sudanese
100.0
/100
|
#2
Exceptional
4.6%
Immigrants | Venezuela
100.0
/100
|
#3
Exceptional
4.6%
Immigrants | Nepal
100.0
/100
|
#4
Exceptional
4.7%
Venezuelans
100.0
/100
|
#5
Exceptional
4.7%
Immigrants | Bosnia and Herzegovina
100.0
/100
|
#6
Exceptional
4.7%
Thais
100.0
/100
|
#7
Exceptional
4.7%
Immigrants | Eritrea
100.0
/100
|
#8
Exceptional
4.7%
Bulgarians
99.9
/100
|
#9
Exceptional
4.7%
Tongans
99.9
/100
|
#10
Exceptional
4.8%
Immigrants | Bolivia
99.9
/100
|
#11
Exceptional
4.8%
Filipinos
99.9
/100
|
#12
Exceptional
4.8%
Cambodians
99.9
/100
|
#13
Exceptional
4.8%
Luxembourgers
99.9
/100
|
#14
Exceptional
4.8%
Okinawans
99.9
/100
|
#15
Exceptional
4.8%
Zimbabweans
99.9
/100
|
#16
Exceptional
4.8%

Demographics Similar to Soviet Union by Unemployment Among Ages 30 to 34 years

In terms of unemployment among ages 30 to 34 years, the demographic groups most similar to Soviet Union are Immigrants from Hong Kong (5.0%, a difference of 0.10%), Immigrants from Belgium (5.1%, a difference of 0.14%), Yugoslavian (5.1%, a difference of 0.17%), Immigrants from Vietnam (5.0%, a difference of 0.28%), and Immigrants from Eastern Africa (5.0%, a difference of 0.28%).
DemographicsRating | RankUnemployment Among Ages 30 to 34 years
Czechs
99.2
/100
|
#36
Exceptional
5.0%
Immigrants | Turkey
99.0
/100
|
#37
Exceptional
5.0%
Sri Lankans
99.0
/100
|
#38
Exceptional
5.0%
Fijians
99.0
/100
|
#39
Exceptional
5.0%
Immigrants | Vietnam
98.9
/100
|
#40
Exceptional
5.0%
Immigrants | Eastern Africa
98.9
/100
|
#41
Exceptional
5.0%
Immigrants | Hong Kong
98.8
/100
|
#42
Exceptional
5.0%
Soviet Union
98.8
/100
|
#43
Exceptional
5.0%
Immigrants | Belgium
98.7
/100
|
#44
Exceptional
5.1%
Yugoslavians
98.6
/100
|
#45
Exceptional
5.1%
Immigrants | Congo
98.4
/100
|
#46
Exceptional
5.1%
Cypriots
98.4
/100
|
#47
Exceptional
5.1%
Assyrians/Chaldeans/Syriacs
98.4
/100
|
#48
Exceptional
5.1%
Immigrants | Malaysia
98.3
/100
|
#49
Exceptional
5.1%
Puget Sound Salish
98.2
/100
|
#50
Exceptional
5.1%