Brazilian vs Immigrants from Moldova Unemployment Among Ages 16 to 19 years
COMPARE
Brazilian
Immigrants from Moldova
Unemployment Among Ages 16 to 19 years
Unemployment Among Ages 16 to 19 years Comparison
Brazilians
Immigrants from Moldova
17.1%
UNEMPLOYMENT AMONG AGES 16 TO 19 YEARS
92.3/ 100
METRIC RATING
115th/ 347
METRIC RANK
17.1%
UNEMPLOYMENT AMONG AGES 16 TO 19 YEARS
90.7/ 100
METRIC RATING
121st/ 347
METRIC RANK
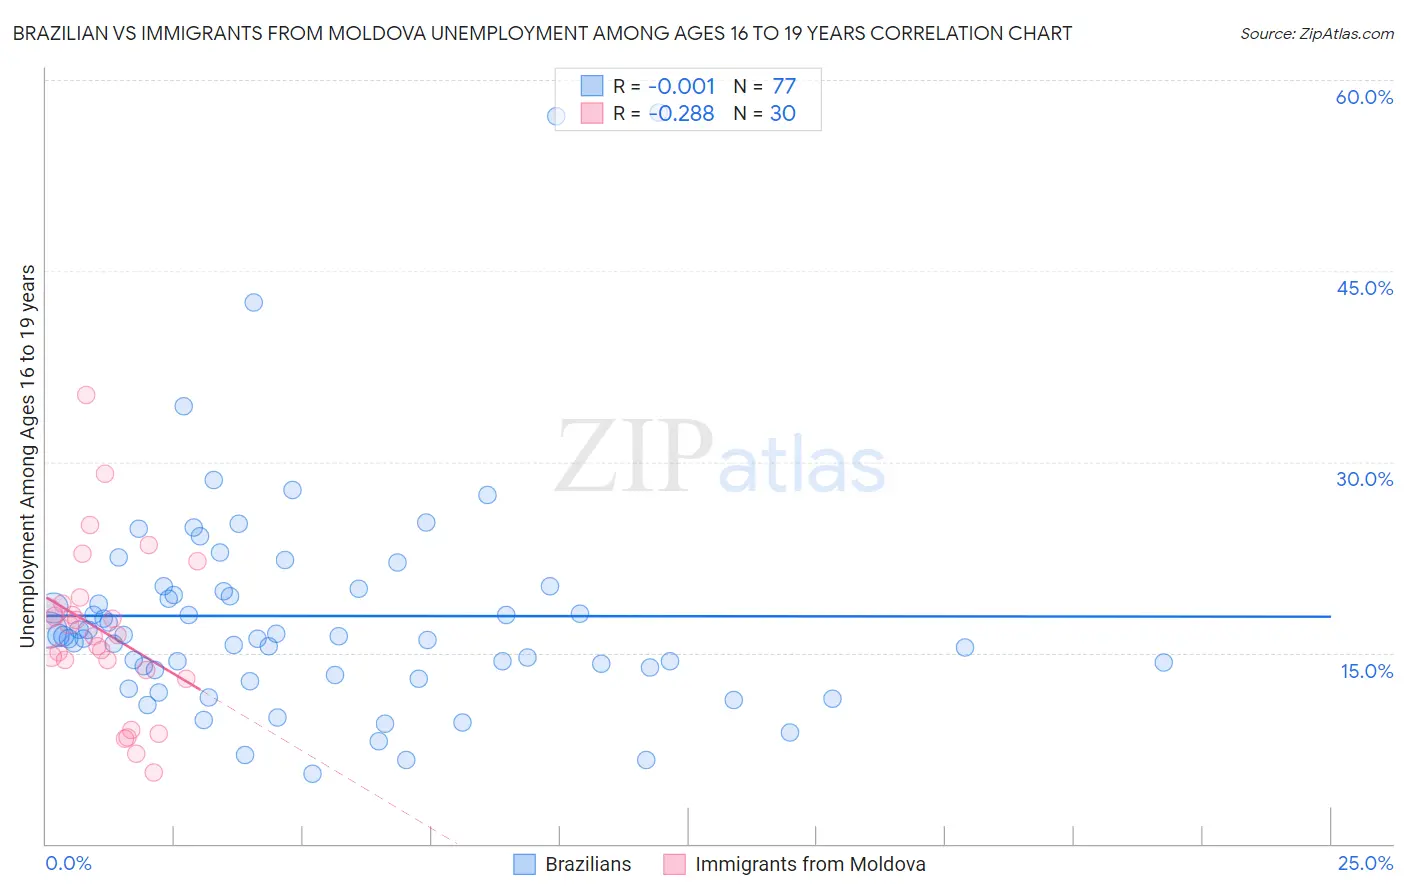
Brazilian vs Immigrants from Moldova Unemployment Among Ages 16 to 19 years Correlation Chart
The statistical analysis conducted on geographies consisting of 310,579,987 people shows no correlation between the proportion of Brazilians and unemployment rate among population between the ages 16 and 19 in the United States with a correlation coefficient (R) of -0.001 and weighted average of 17.1%. Similarly, the statistical analysis conducted on geographies consisting of 121,441,802 people shows a weak negative correlation between the proportion of Immigrants from Moldova and unemployment rate among population between the ages 16 and 19 in the United States with a correlation coefficient (R) of -0.288 and weighted average of 17.1%, a difference of 0.24%.
Unemployment Among Ages 16 to 19 years Correlation Summary
| Measurement | Brazilian | Immigrants from Moldova |
| Minimum | 5.5% | 5.6% |
| Maximum | 57.4% | 35.3% |
| Range | 51.9% | 29.7% |
| Mean | 17.9% | 16.6% |
| Median | 16.3% | 16.4% |
| Interquartile 25% (IQ1) | 13.5% | 13.6% |
| Interquartile 75% (IQ3) | 19.9% | 18.8% |
| Interquartile Range (IQR) | 6.5% | 5.2% |
| Standard Deviation (Sample) | 9.0% | 6.5% |
| Standard Deviation (Population) | 8.9% | 6.4% |
Demographics Similar to Brazilians and Immigrants from Moldova by Unemployment Among Ages 16 to 19 years
In terms of unemployment among ages 16 to 19 years, the demographic groups most similar to Brazilians are Immigrants from Korea (17.1%, a difference of 0.020%), Immigrants from Sri Lanka (17.1%, a difference of 0.050%), Venezuelan (17.1%, a difference of 0.070%), Hungarian (17.1%, a difference of 0.11%), and Immigrants from Poland (17.0%, a difference of 0.14%). Similarly, the demographic groups most similar to Immigrants from Moldova are Immigrants from South Eastern Asia (17.1%, a difference of 0.010%), Immigrants from Middle Africa (17.1%, a difference of 0.020%), Hungarian (17.1%, a difference of 0.13%), Venezuelan (17.1%, a difference of 0.17%), and Immigrants from Sri Lanka (17.1%, a difference of 0.19%).
| Demographics | Rating | Rank | Unemployment Among Ages 16 to 19 years |
| Malaysians | 94.2 /100 | #108 | Exceptional 17.0% |
| Iranians | 94.1 /100 | #109 | Exceptional 17.0% |
| Immigrants | Netherlands | 93.9 /100 | #110 | Exceptional 17.0% |
| Immigrants | Asia | 93.9 /100 | #111 | Exceptional 17.0% |
| Immigrants | Iraq | 93.7 /100 | #112 | Exceptional 17.0% |
| Icelanders | 93.4 /100 | #113 | Exceptional 17.0% |
| Immigrants | Poland | 93.1 /100 | #114 | Exceptional 17.0% |
| Brazilians | 92.3 /100 | #115 | Exceptional 17.1% |
| Immigrants | Korea | 92.2 /100 | #116 | Exceptional 17.1% |
| Immigrants | Sri Lanka | 92.0 /100 | #117 | Exceptional 17.1% |
| Venezuelans | 91.8 /100 | #118 | Exceptional 17.1% |
| Hungarians | 91.6 /100 | #119 | Exceptional 17.1% |
| Immigrants | Middle Africa | 90.9 /100 | #120 | Exceptional 17.1% |
| Immigrants | Moldova | 90.7 /100 | #121 | Exceptional 17.1% |
| Immigrants | South Eastern Asia | 90.7 /100 | #122 | Exceptional 17.1% |
| Immigrants | Laos | 88.8 /100 | #123 | Excellent 17.1% |
| Syrians | 88.6 /100 | #124 | Excellent 17.1% |
| Immigrants | Germany | 87.7 /100 | #125 | Excellent 17.2% |
| Immigrants | Bolivia | 86.7 /100 | #126 | Excellent 17.2% |
| Pakistanis | 85.8 /100 | #127 | Excellent 17.2% |
| Australians | 85.6 /100 | #128 | Excellent 17.2% |